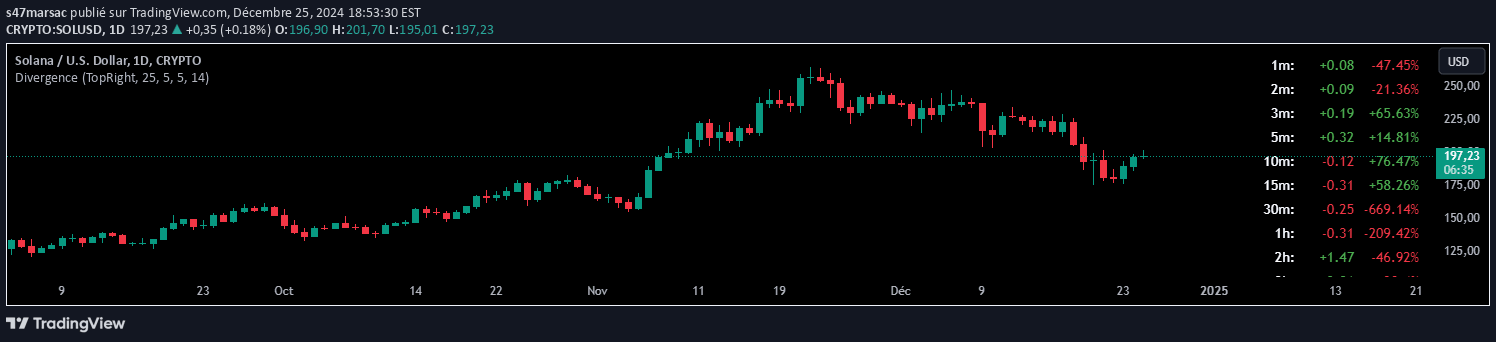
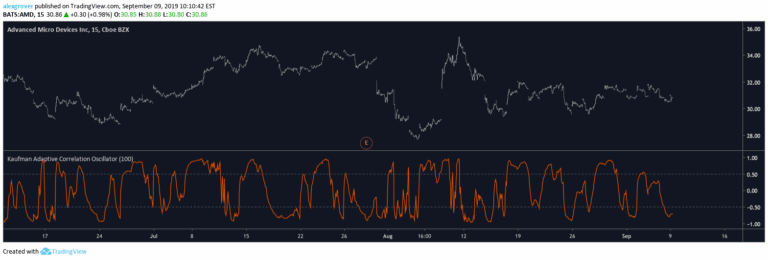
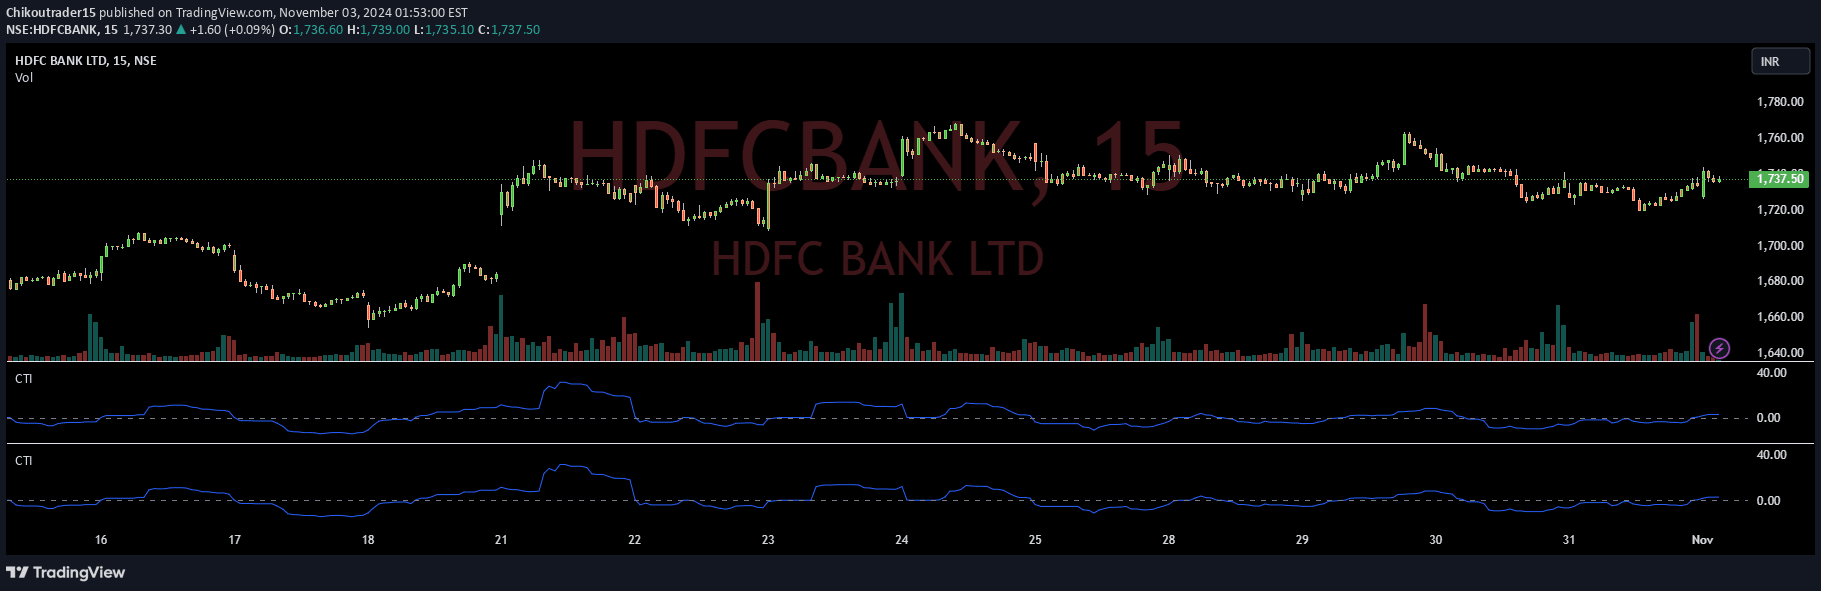
A probabilistic trading signal that evaluates potential price movements by comparing likelihood of price increases versus decreases. Helps traders predict potential price discovery scenarios using comparative probability analysis.
Explore complementary indicator rolesHow it works
The signal starts by calculating the probability of potential price increases and decreases using historical market data and statistical modeling. It analyzes past price movements, market trends, and statistical distributions to generate comparative probabilities. Complex algorithms assess multiple market variables to determine potential directional shifts.
Mathematical models compute the likelihood of upward and downward price movements. The analysis considers factors like recent price history, market volatility, and statistical variance. Advanced statistical techniques help quantify potential price discovery scenarios. The final output provides a probabilistic assessment of potential market direction
Why it may be useful
This signal provides traders with a quantitative approach to understanding potential market movements beyond traditional technical analysis. It offers a probabilistic perspective that helps traders make more informed decisions under uncertainty. By comparing potential upside and downside scenarios, traders can better manage risk and potential returns.
The signal transforms complex market data into actionable insights about potential price trajectories. It helps traders move beyond subjective interpretations towards more data-driven trading strategies. The probabilistic framework allows for more nuanced market understanding. Ultimately, it enhances decision-making by providing a statistical foundation for trade considerations
When to explore it
The signal works best in markets with clear historical data and relatively stable statistical patterns. It is most effective during periods of moderate market volatility where historical trends provide meaningful insights. Traders should apply this signal when seeking a more quantitative approach to market analysis. It performs well in markets with sufficient historical price data for robust statistical modeling.
The signal is particularly useful for traders wanting to understand potential price movements beyond traditional technical indicators. It becomes more reliable with larger datasets and more comprehensive market information. Traders should combine this signal with other analytical tools for comprehensive market assessment
Keep exploring
What we’ve verified
Access, alerts and repainting behaviour have not been independently verified for this indicator. Check the creator’s current publication and settings.
General descriptions and classifications are recovered research. Verified details above identify the specific checks we have completed. Check the creator’s current publication for later changes.