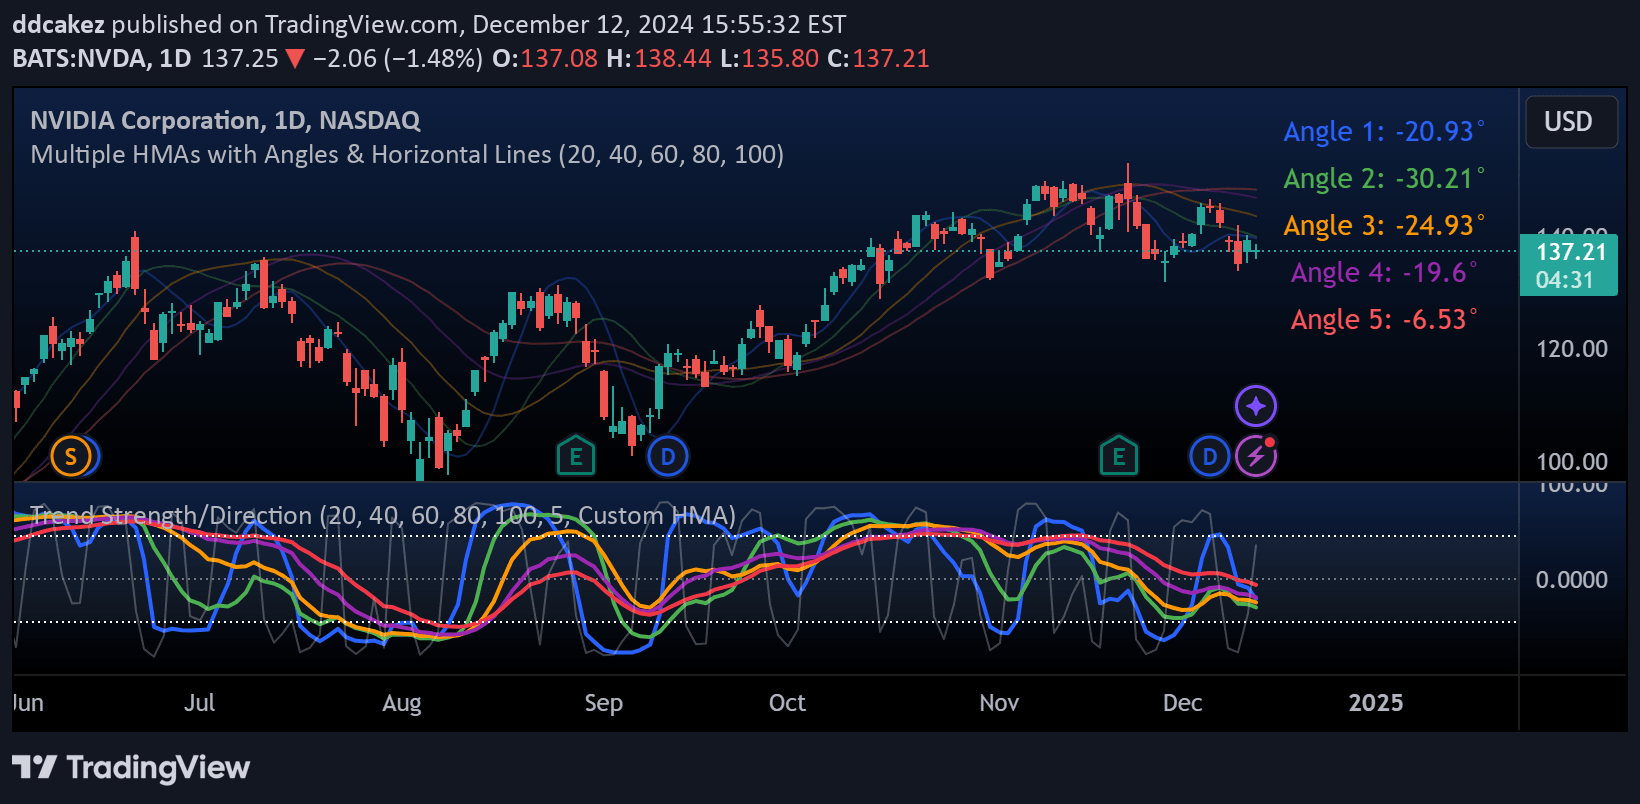
A trading signal that calculates price behavior by comparing close prices to Hull Moving Average (HMA) and integrating exponential and simple moving average differences.
Explore complementary indicator rolesHow it works
The indicator starts by calculating the difference between the closing price and the Hull Moving Average (HMA). It then analyzes price movements within a specific lookback period by capturing instances where price is above or below the HMA.
During this analysis, the indicator squares the price differences to amplify larger variations, which helps in detecting potential breakouts. By adding these squared values and subtracting negative values from positive ones, the indicator generates a single numeric representation of price behavior during the lookback period.
Why it may be useful
This signal provides traders with a nuanced view of price momentum and trend strength by integrating multiple moving average calculations. By squaring price differences, it gives more weight to significant price movements, helping traders identify potential trend changes and breakout opportunities.
The combination of Hull Moving Average, exponential moving average, and simple moving average creates a comprehensive approach to market analysis. This multi-layered methodology allows traders to gain deeper insights into price dynamics and potential trading signals.
When to explore it
The indicator is most effective in markets with clear trending characteristics and moderate volatility. It works particularly well in timeframes that allow for quick identification of momentum shifts, such as intraday and short-term trading scenarios.
Traders should consider using this signal during periods of potential trend initiation or reversal, especially when seeking to confirm price movements through a robust, mathematically derived approach. It is particularly useful for traders who want a sophisticated method of analyzing price behavior beyond traditional moving average strategies.
Keep exploring
What we’ve verified
Access, alerts and repainting behaviour have not been independently verified for this indicator. Check the creator’s current publication and settings.
General descriptions and classifications are recovered research. Verified details above identify the specific checks we have completed. Check the creator’s current publication for later changes.