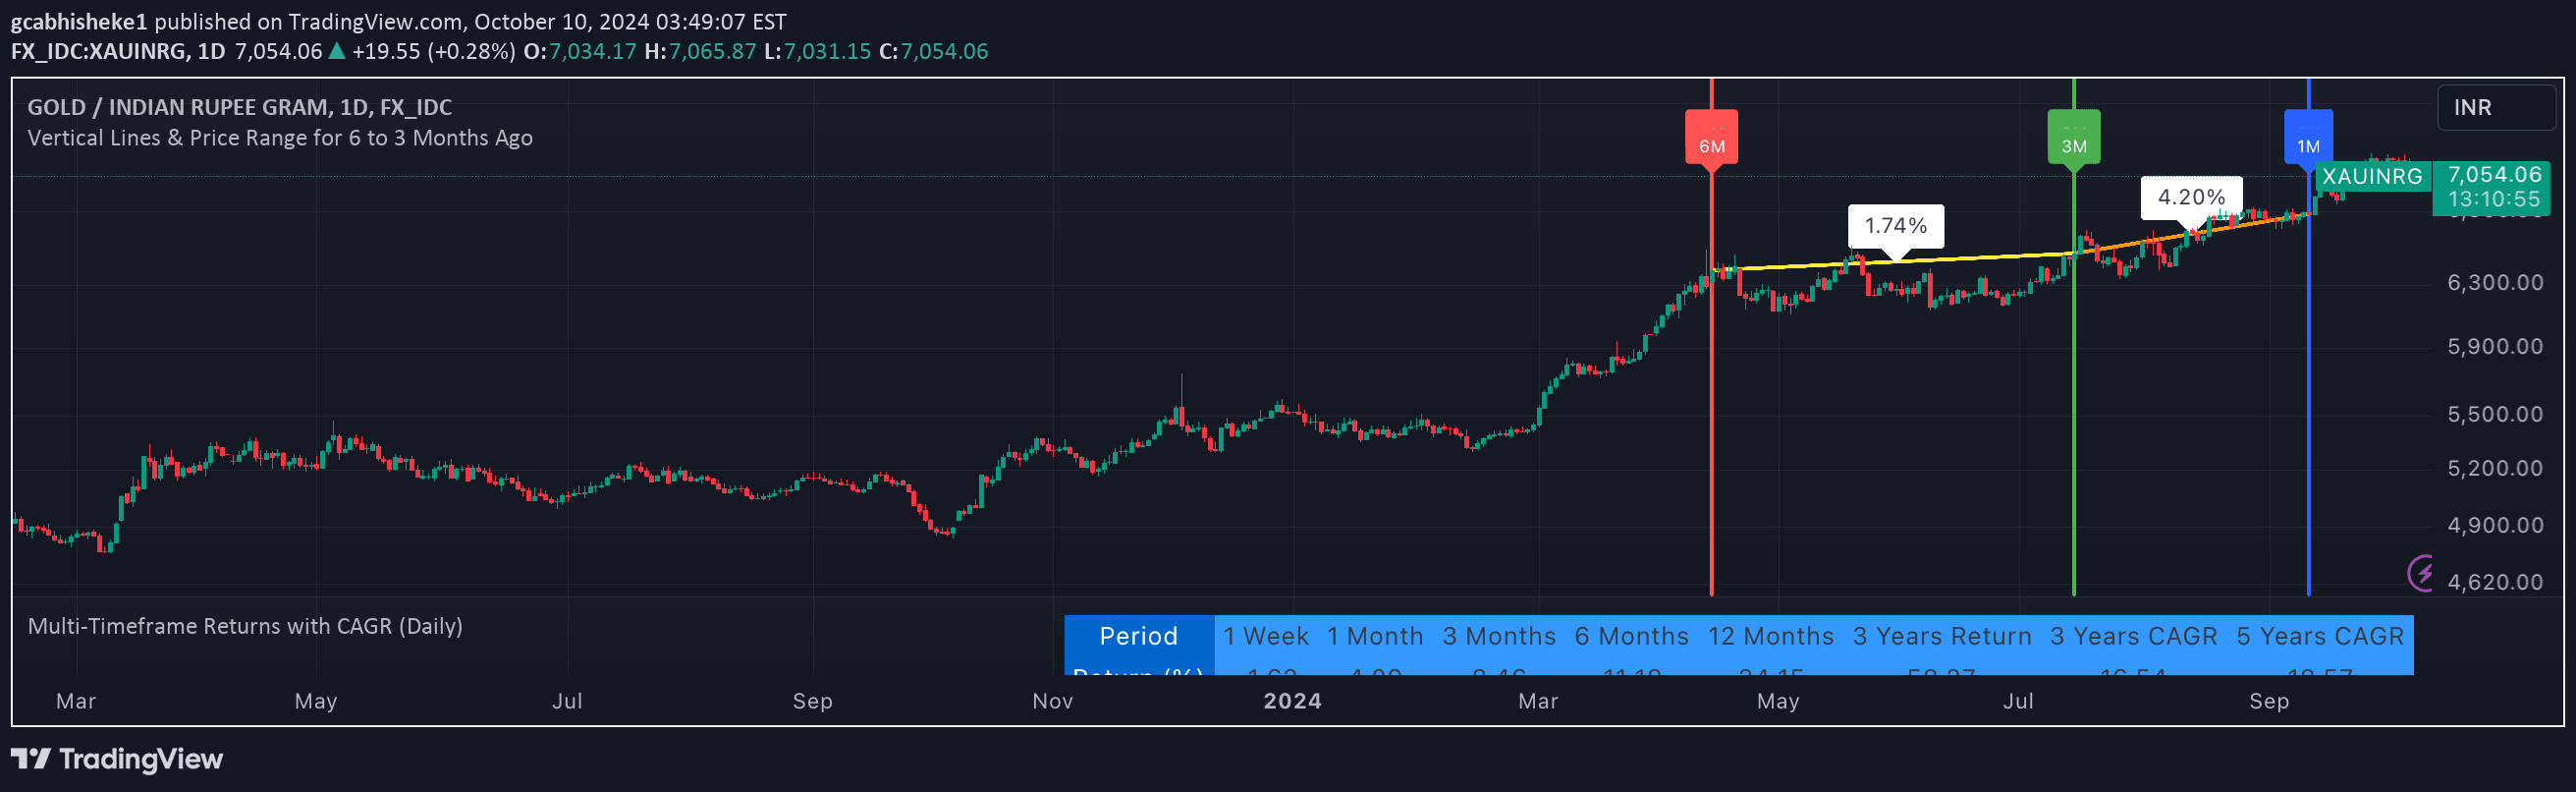
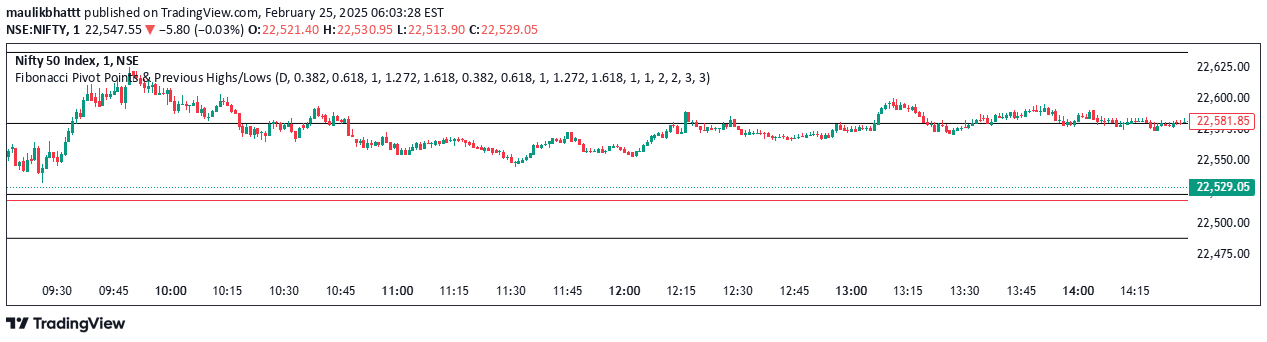
An option chain indicator that displays strike price levels for different indices, helping traders identify key price points and potential trading opportunities across Bank Nifty, Nifty 50, and FinNifty indices.
Explore complementary indicator rolesHow it works
The option chain indicator identifies specific strike price levels with predetermined point gaps for different indices. For Bank Nifty, it uses 100-point differences, while Nifty 50 and FinNifty use 50-point gaps between strike prices. Traders can plot these levels directly on their charts, creating visual reference points that help track potential price movements and option premium changes.
The indicator allows users to customize the number of lines and adjust the gap between levels according to their trading preferences. Each plotted level includes a tooltip displaying the current price (LTP) and the point difference from that level, providing traders with real-time contextual information to support their trading decisions.
Why it may be useful
Option chain levels are crucial because they highlight psychological price points that significantly impact trading behavior. Round numbers and specific strike prices often act as natural support and resistance zones, influencing option premiums and trader sentiment. These levels help traders understand where more trading activity occurs, such as increased straddle or strangle positions and higher call or put writing.
By visualizing these key price levels, traders gain insights into potential market movements and can make more informed trading decisions. The indicator helps identify areas of market interest, potential trend reversals, and zones where increased trading activity might occur, ultimately enhancing traders' strategic approach to market analysis.
When to explore it
The option chain indicator is most effective during periods of market volatility and when trading index options. It works best for traders who want to understand underlying market structure and identify potential entry and exit points based on psychological price levels. Traders can use this tool to complement their existing strategies, particularly when looking for support and resistance zones.
The indicator is particularly useful for day traders and scalpers who need quick, visual references to make rapid trading decisions. It helps traders anticipate potential price movements around specific strike prices and understand where market participants might be concentrating their trading activities, making it a valuable tool for short-term trading strategies.
Keep exploring
What we’ve verified
Access, alerts and repainting behaviour have not been independently verified for this indicator. Check the creator’s current publication and settings.
General descriptions and classifications are recovered research. Verified details above identify the specific checks we have completed. Check the creator’s current publication for later changes.