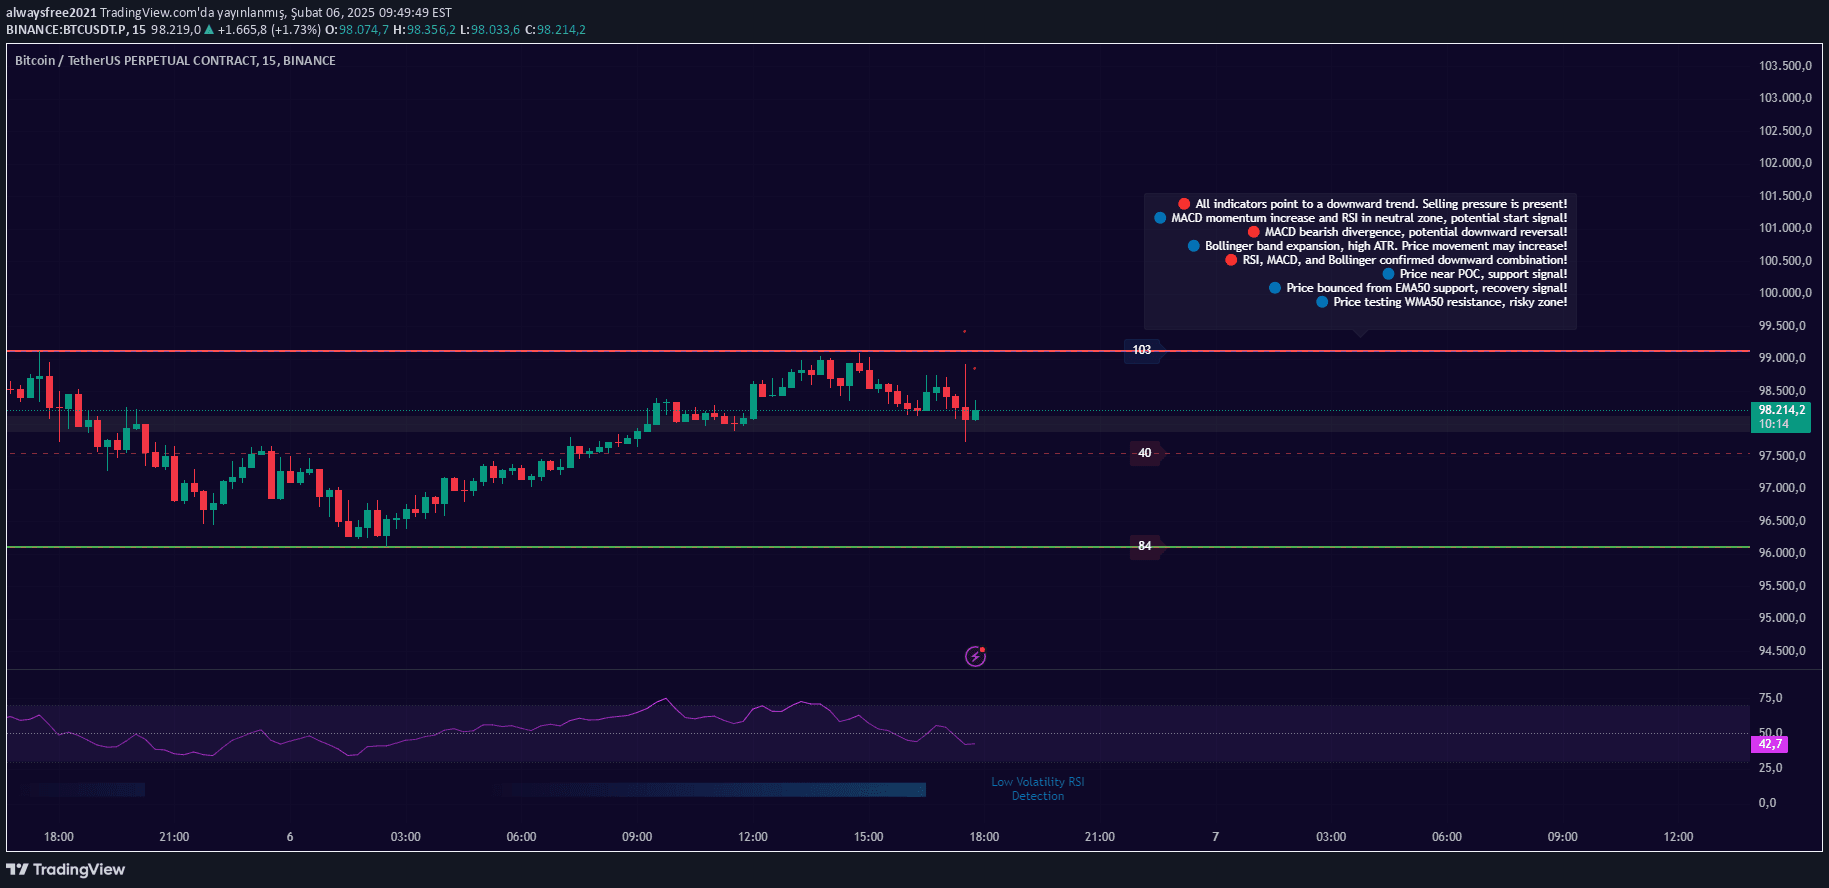
A Pine Script indicator using RSI to identify overbought and oversold market conditions by plotting levels when specific threshold crossovers occur, providing potential entry and exit signals.
Explore complementary indicator rolesHow it works
This script utilizes the Relative Strength Index (RSI) with predefined overbought (70) and oversold (30) thresholds to generate trading signals. When the RSI crosses above the overbought level or below the oversold level, the script produces an output value of 1.0 or -1. 0 respectively.
These crossover events indicate potential market reversals or momentum shifts. The script can be integrated with an external level script to visually mark resistance or support levels based on these RSI threshold crossings
Why it may be useful
The RSI threshold crossover method helps traders identify potential market turning points by measuring momentum and detecting overbought or oversold conditions. By providing clear visual signals and numeric outputs, traders can make more informed decisions about market entry and exit points.
This approach offers a systematic way to interpret market sentiment and potential trend reversals, reducing emotional trading and providing a structured approach to technical analysis
When to explore it
This RSI strategy works best in trending and range-bound markets with consistent price movements. It is particularly effective in markets with clear cyclical behavior and when used in conjunction with other technical indicators.
Traders should apply this method on timeframes from 1-minute to daily charts, ensuring sufficient data for accurate RSI calculations. It is most reliable when combined with additional confirmation signals from volume, trend, or other momentum indicators
Keep exploring
What we’ve verified
Access, alerts and repainting behaviour have not been independently verified for this indicator. Check the creator’s current publication and settings.
General descriptions and classifications are recovered research. Verified details above identify the specific checks we have completed. Check the creator’s current publication for later changes.