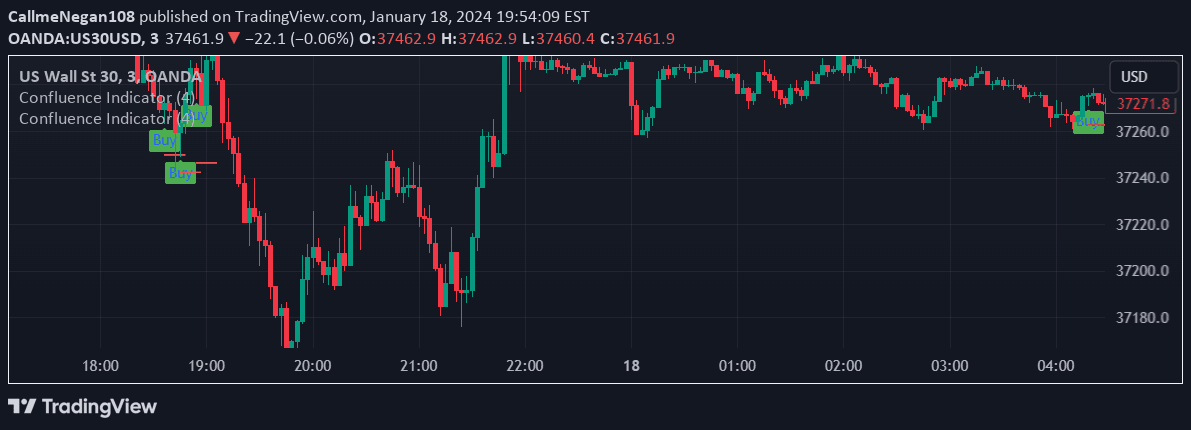
A price action strategy that identifies structured trading opportunities using momentum shifts, volume analysis, and breakout confirmations across multiple market conditions.
Explore complementary indicator rolesHow it works
The RDBRB strategy operates by detecting short-term momentum shifts through moving average crossovers, identifying rallies and drops in price action. It establishes a statistical base using moving average bands and tracks price movements relative to these bands.
The strategy then validates potential trades through a multi-step confirmation process, checking volume thresholds, RSI momentum levels, and trend alignment with longer-term moving averages. Each signal type (Rally, Drop, Retest, Breakout) has independent cooldown periods to filter out noise and ensure meaningful trade signals.
Why it may be useful
This strategy provides traders with a structured, rule-based approach to identifying high-probability trading opportunities across different market conditions. By combining multiple technical indicators and filtering mechanisms, it reduces false signals and enhances trade entry precision.
The systematic approach helps traders maintain discipline by providing clear entry and exit criteria, reducing emotional decision-making. Its flexibility across timeframes and markets makes it a versatile tool for traders seeking a methodical approach to identifying potential trading opportunities.
When to explore it
The RDBRB strategy works best in markets with clear trending or consolidating price action, where momentum and volume provide reliable trade signals. It is particularly effective in liquid markets with sufficient price movement and trading volume.
Traders should use this strategy on multiple timeframes, preferably combining higher-timeframe confirmations to increase signal reliability. It is most suitable for markets like forex, stocks, and cryptocurrencies that exhibit predictable momentum and volume characteristics.
Keep exploring
What we’ve verified
Access, alerts and repainting behaviour have not been independently verified for this indicator. Check the creator’s current publication and settings.
General descriptions and classifications are recovered research. Verified details above identify the specific checks we have completed. Check the creator’s current publication for later changes.