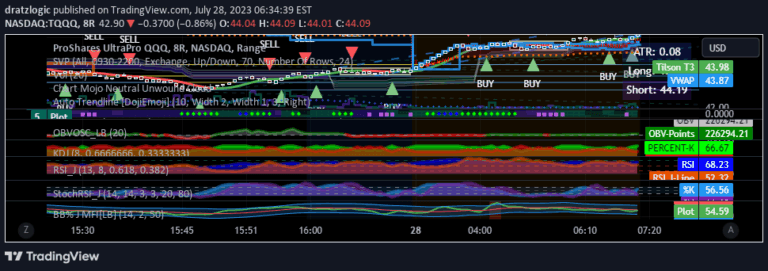
A dynamic trading indicator combining RSI and Stochastic RSI to provide insights into market momentum and potential reversal points with customizable parameters.
Explore complementary indicator rolesHow it works
The ReadyFor401k Stoch + RSI indicator first calculates the traditional Relative Strength Index (RSI) using a specified period, which measures the magnitude of recent price changes to evaluate overbought or oversold conditions. It then applies a Stochastic calculation to the RSI values, creating a more refined momentum oscillator that provides deeper insights into price dynamics.
The indicator employs a gradient color scheme that changes based on the RSI's position between customizable overbought and oversold levels. This visual representation allows traders to quickly interpret market conditions, with the color and background fill highlighting potential reversal zones and momentum shifts in real-time.
Why it may be useful
This indicator is crucial for traders seeking a nuanced understanding of market momentum and potential trend reversals. By combining RSI and Stochastic RSI, it offers a more comprehensive view of price action than traditional single-method indicators, helping traders identify subtle shifts in market sentiment and potential entry or exit points.
The dynamic visual presentation makes complex technical analysis more accessible, allowing traders to quickly interpret market conditions without getting bogged down in numerical calculations. Its ability to provide early warning signals for potential market reversals can significantly enhance a trader's decision-making process and risk management strategy.
When to explore it
The Stoch + RSI indicator is most effective in markets with clear momentum patterns, particularly during trending and range-bound market conditions. It performs exceptionally well when traders need to identify potential reversal points, such as when an asset approaches overbought or oversold levels, providing timely signals for market entry or exit.
Traders can optimize the indicator's performance by adjusting its parameters to match specific market characteristics, making it versatile across different timeframes and asset classes. It is particularly useful when combined with other technical analysis tools, offering complementary insights that can confirm or challenge signals from other indicators.
Keep exploring
What we’ve verified
Access, alerts and repainting behaviour have not been independently verified for this indicator. Check the creator’s current publication and settings.
General descriptions and classifications are recovered research. Verified details above identify the specific checks we have completed. Check the creator’s current publication for later changes.