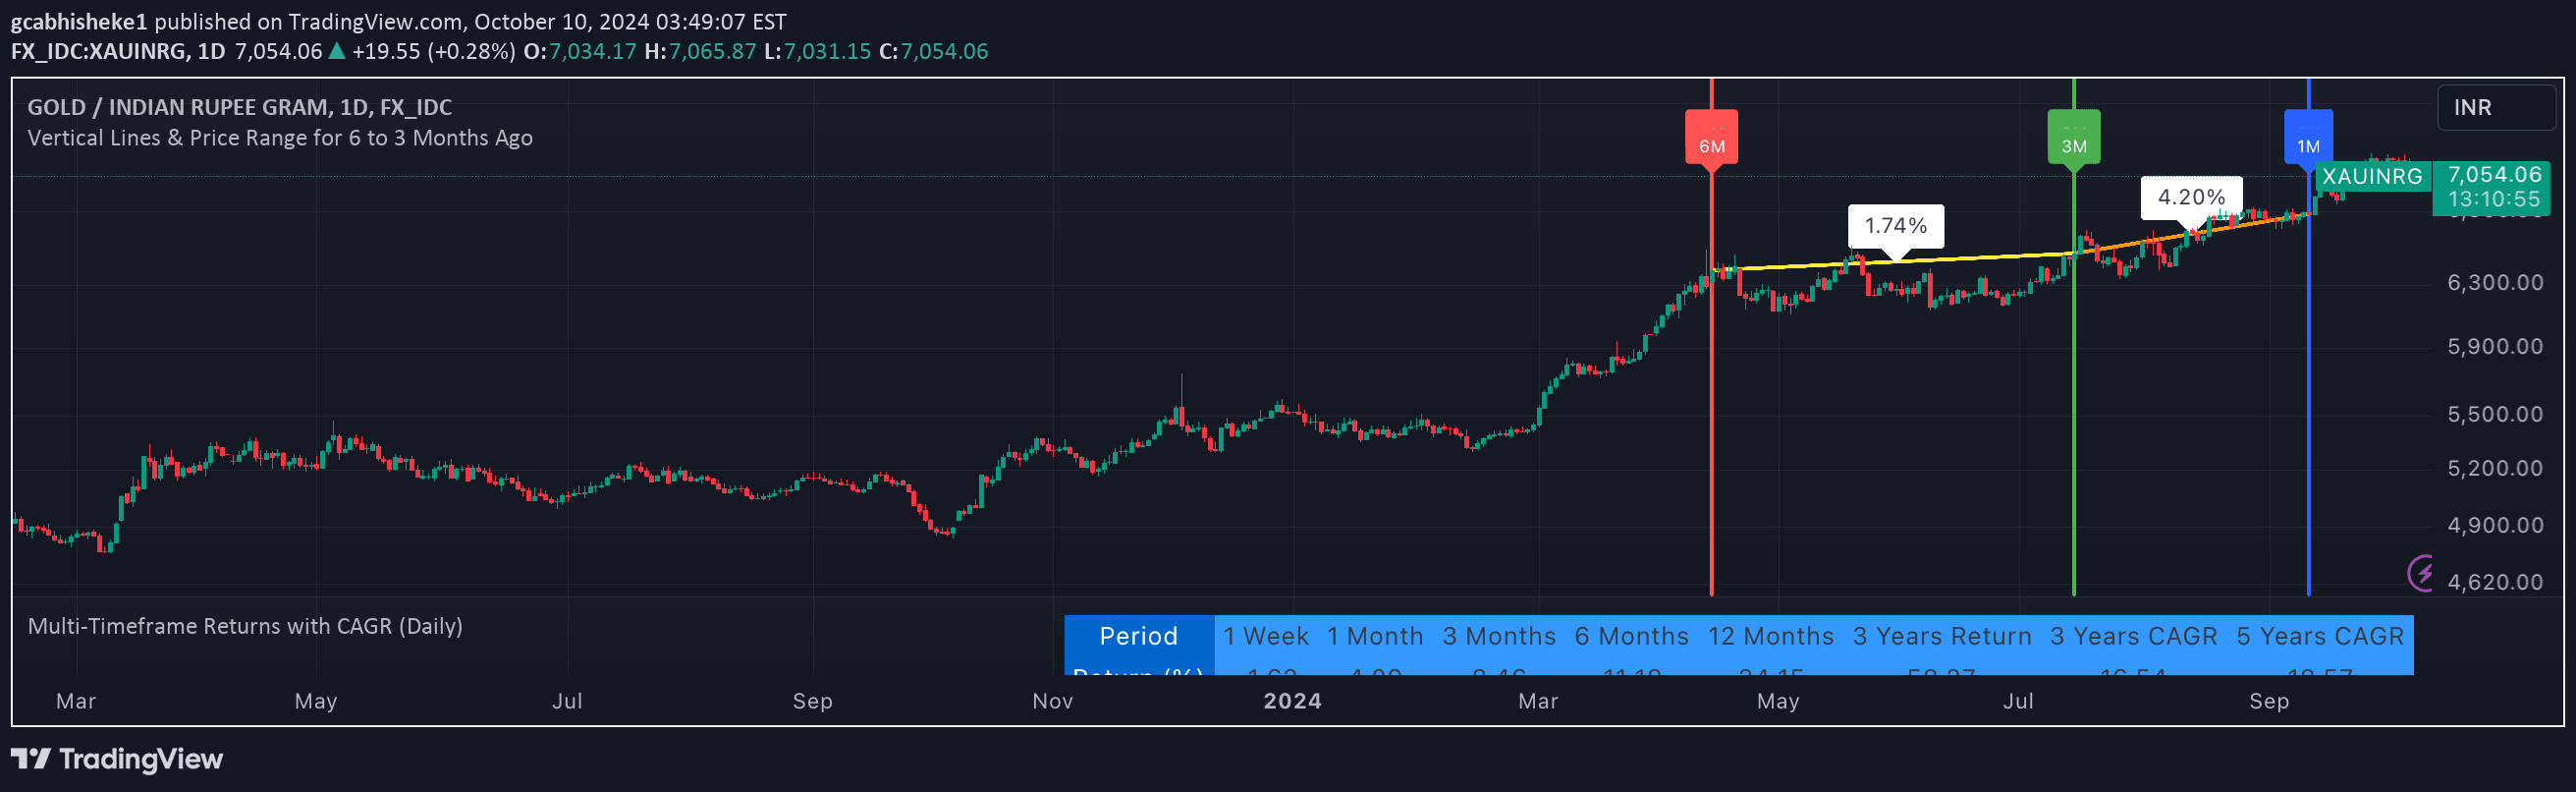
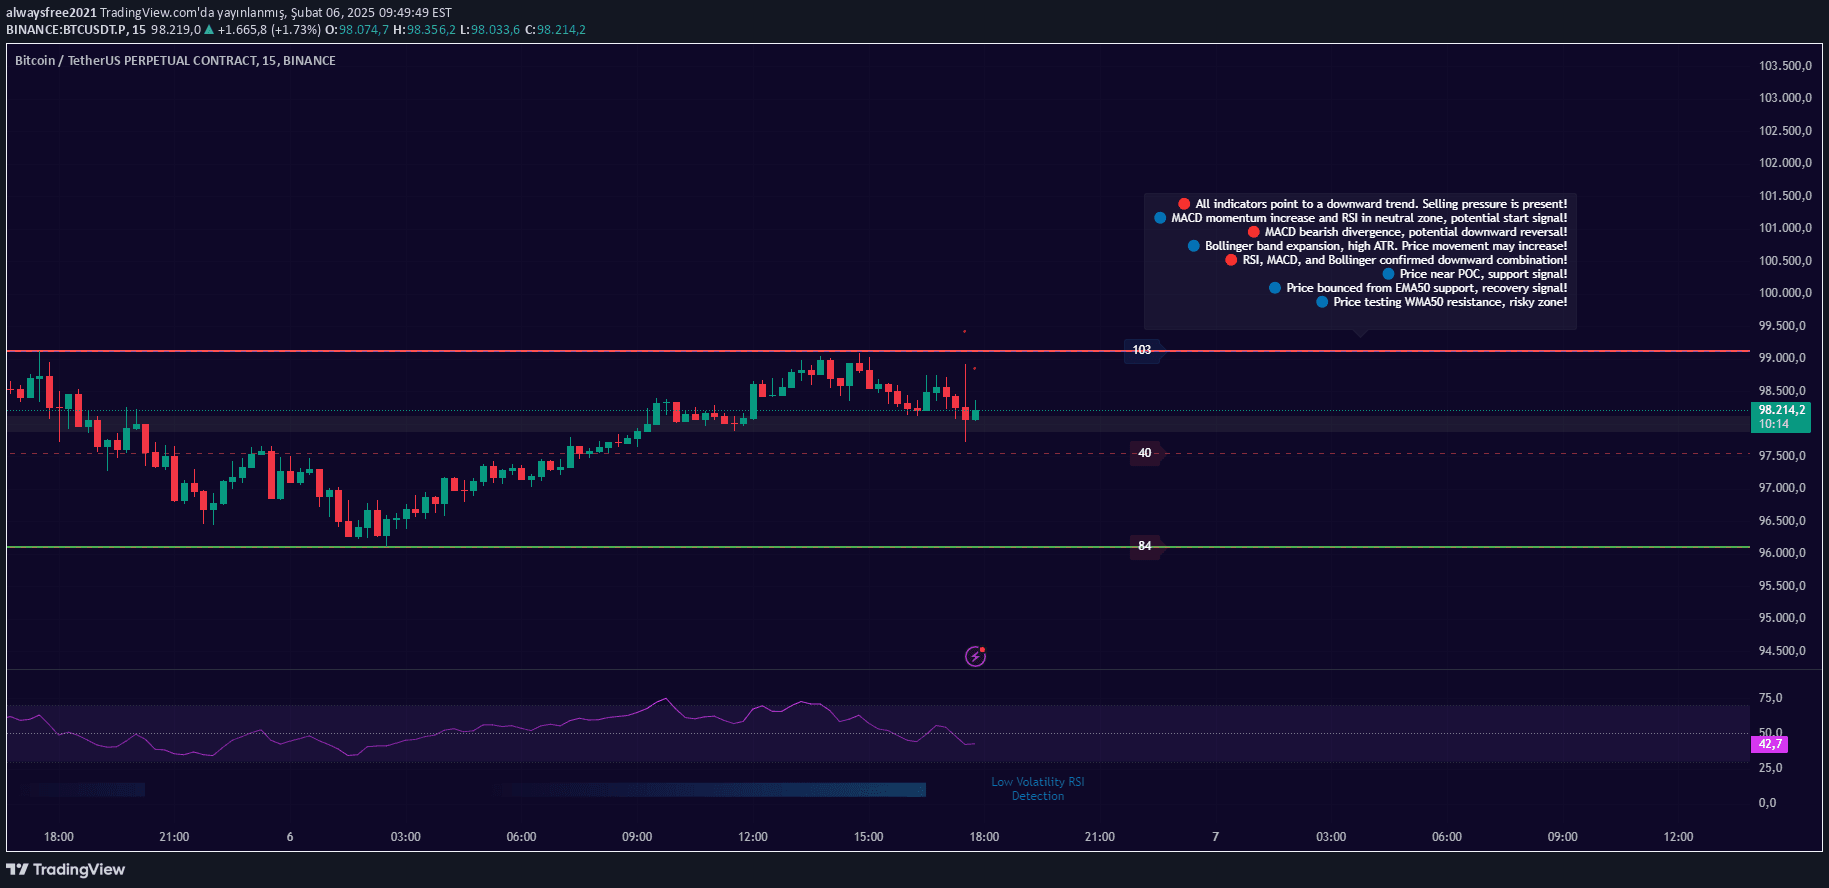
A dynamic horizontal price line that updates in real-time, changing color to reflect the current candle's bullish or bearish direction, providing an instant visual representation of market sentiment.
Explore complementary indicator rolesHow it works
The indicator creates a horizontal line at the current price that extends infinitely across the chart, automatically updating with each new candle. It uses a simple color-coding mechanism to instantly communicate market direction: green for bullish candles where the close price is equal to or higher than the open price, and red for bearish candles where the close price is lower than the open price.
This dynamic line redraws on each bar, ensuring traders always have an up-to-the-moment visual reference of the current price level and its recent directional bias. The line's simplicity allows traders to quickly gauge market sentiment without complex calculations or multiple indicator overlays.
Why it may be useful
This indicator provides traders with an immediate, intuitive visual representation of current market dynamics, helping them quickly understand price movement and sentiment. By color-coding the horizontal line based on candle performance, it offers a rapid way to assess whether buyers or sellers are currently in control of the market.
The real-time updating feature ensures traders are always looking at the most current price information, reducing the cognitive load of constantly tracking price changes. Its simplicity makes it an excellent companion tool for traders who want a straightforward, at-a-glance understanding of market direction.
When to explore it
This indicator is most effective in volatile or rapidly moving markets where quick visual cues are crucial for decision-making. It's particularly useful for traders engaged in short-term trading strategies like scalping and day trading, where understanding immediate price momentum is critical.
Traders can use this tool in conjunction with other technical indicators to confirm trends, identify potential entry and exit points, and get a quick sense of market sentiment. It's especially helpful during news events, earnings reports, or other periods of significant market movement where price can change rapidly.
Keep exploring
What we’ve verified
Access, alerts and repainting behaviour have not been independently verified for this indicator. Check the creator’s current publication and settings.
General descriptions and classifications are recovered research. Verified details above identify the specific checks we have completed. Check the creator’s current publication for later changes.