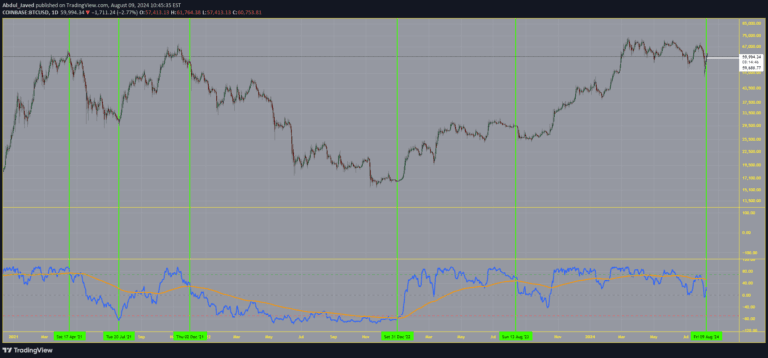
The Percentage Price Oscillator (PPO) is a momentum indicator measuring the difference between two moving averages as a percentage, providing comparative analysis across different securities.
Explore complementary indicator rolesHow it works
The Percentage Price Oscillator calculates the difference between two moving averages and expresses this as a percentage of the larger moving average. It plots this percentage difference as a line that oscillates around a centerline, similar to the MACD indicator but with percentage-based values.
The PPO includes a signal line, which is typically a moving average of the PPO line itself, and a histogram representing the difference between the PPO and signal lines. Traders watch for crossovers between the PPO and signal line, centerline crossovers, and potential divergences to generate trading signals.
Why it may be useful
The PPO provides traders with a normalized view of momentum that allows for direct comparison between different securities, regardless of their price levels. By converting moving average differences to percentages, it eliminates the bias of absolute price variations and offers a more standardized momentum assessment.
This percentage-based approach enables traders to evaluate relative performance and momentum across diverse financial instruments, making it a versatile tool for comparative analysis and identifying potential trend changes or continuation patterns.
When to explore it
The PPO is most effective in trending markets where clear momentum shifts can be identified through moving average crossovers and centerline transitions. It works particularly well when analyzing securities with different price ranges, as its percentage-based calculation allows for meaningful comparisons.
Traders should use the PPO in conjunction with other technical indicators to confirm signals, particularly during periods of market volatility or when assessing relative performance between different stocks, sectors, or asset classes.
Keep exploring
What we’ve verified
Access, alerts and repainting behaviour have not been independently verified for this indicator. Check the creator’s current publication and settings.
General descriptions and classifications are recovered research. Verified details above identify the specific checks we have completed. Check the creator’s current publication for later changes.