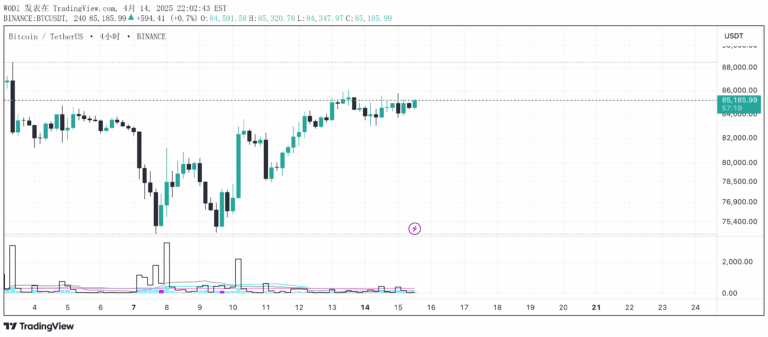
The Relative Volume Indicator compares current trading volume to historical average volume, helping traders identify unusual market activity and potential trend confirmations or reversals.
Explore complementary indicator rolesHow it works
The Relative Volume Indicator calculates current volume as a multiple of historical average volume, typically using a default 20-period lookback period. It generates a visual representation of volume levels through color-coded bars that indicate whether current volume is below average, average, above average, or extreme.
By comparing current volume to historical norms, the indicator helps traders quickly understand the strength and potential significance of price movements. The color coding provides an intuitive way to interpret volume dynamics, with different colors representing varying levels of trading activity and potential market significance.
Why it may be useful
Volume is a critical confirmation tool that helps traders validate price movements and understand market sentiment. The Relative Volume Indicator provides a standardized method to assess whether current trading activity is meaningful or potentially misleading.
By offering a clear visual representation of volume levels, traders can more effectively identify potential breakouts, trend changes, and market events. This indicator helps reduce false signals by providing context around price movements through volume analysis.
When to explore it
The Relative Volume Indicator is most effective during periods of potential market transitions, such as breakouts, trend reversals, or significant price movements. Traders should pay close attention to green and magenta bars, which indicate above-average and extreme volume levels respectively.
This indicator works best when combined with other technical analysis tools, helping to confirm price action and provide additional insight into market dynamics. It is particularly useful in volatile markets where volume can provide critical information about market participation and potential trend strength.
Keep exploring
What we’ve verified
Access, alerts and repainting behaviour have not been independently verified for this indicator. Check the creator’s current publication and settings.
General descriptions and classifications are recovered research. Verified details above identify the specific checks we have completed. Check the creator’s current publication for later changes.