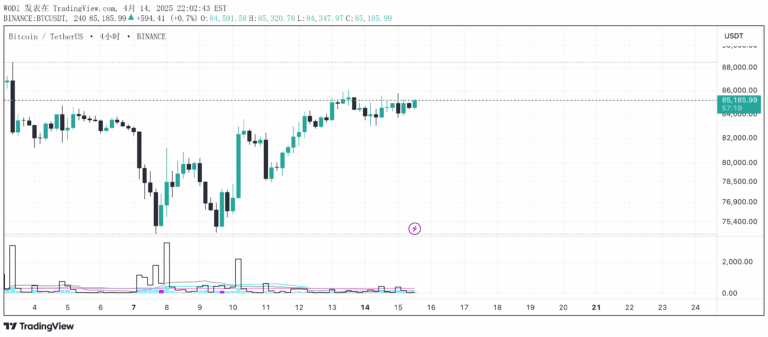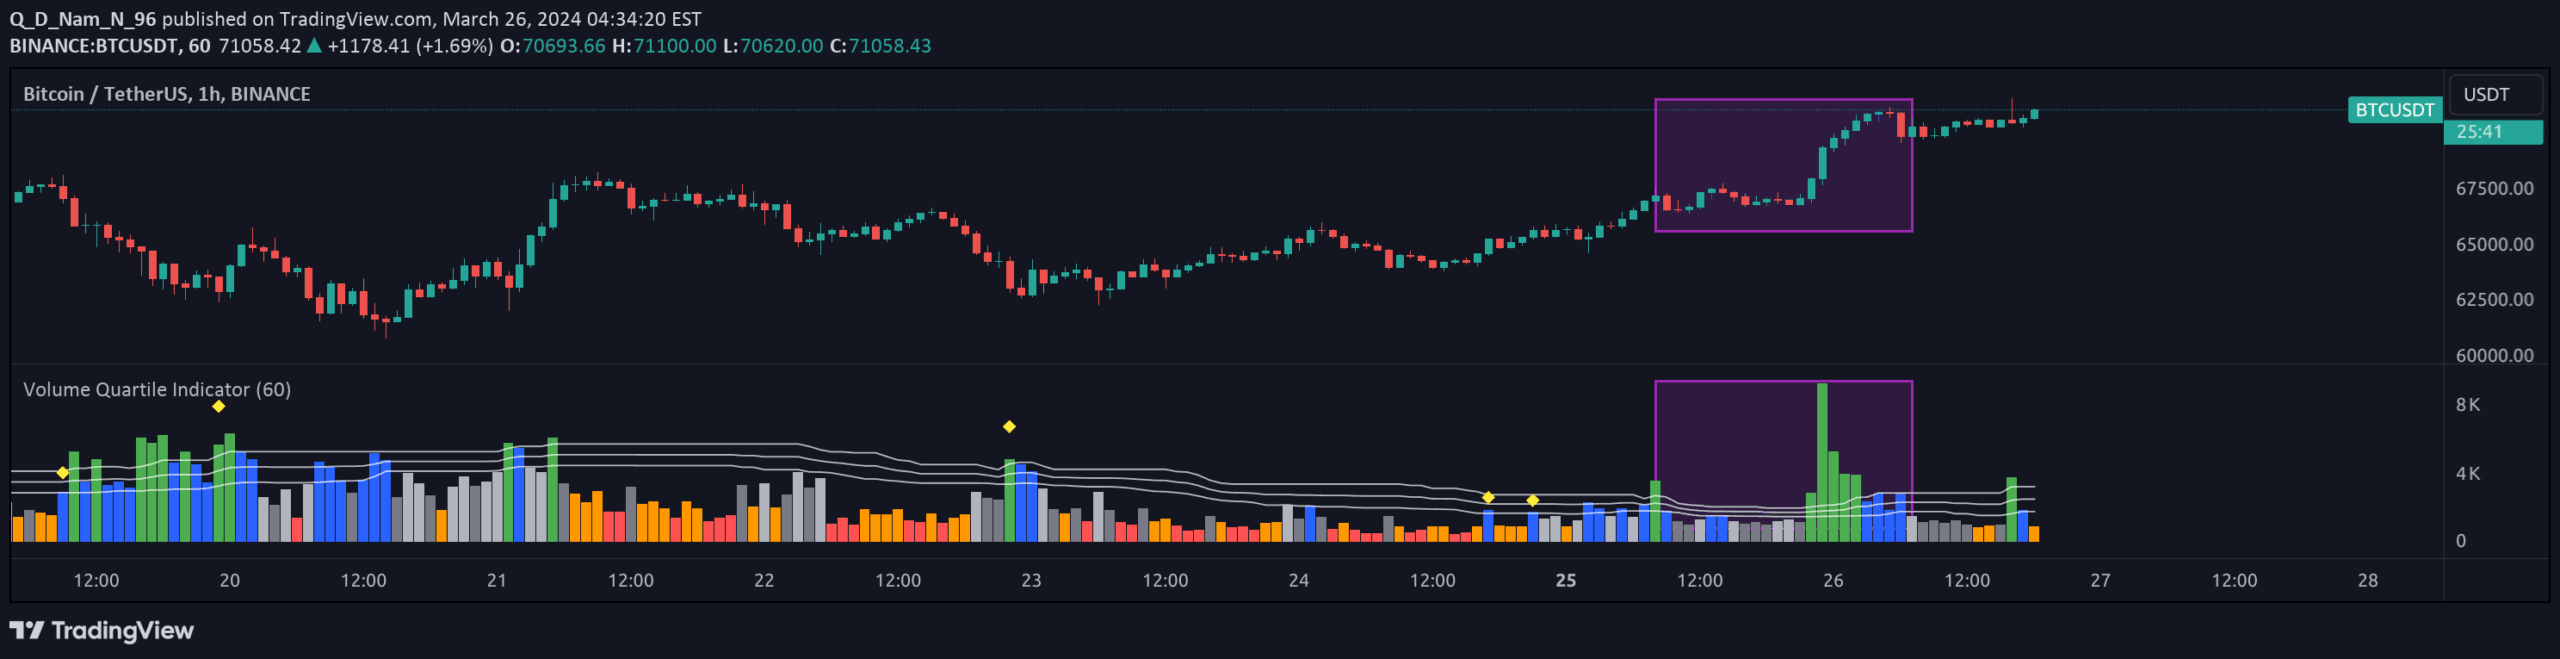
A volume-based indicator that classifies trading volumes into quartiles using color-coded levels, helping traders assess market strength and potential price movements.
Explore complementary indicator rolesHow it works
The Volume Quartile Indicator analyzes trading volumes over a 60-period window, dividing volume data into six distinct quartile ranges. It calculates volume percentiles at 10%, 30%, 50%, 70%, and 90% levels, creating a comprehensive visualization of volume intensity. Each quartile is assigned a specific color to represent different volume strengths, from very weak (red) to very strong (green).
The indicator also incorporates special features like yellow diamond markers to highlight significant volume points and q-lines at 70%, 90%, and their midpoint. These q-lines help traders identify potential volatility and market momentum shifts by showing convergence and divergence in volume patterns.
Why it may be useful
Volume is a critical aspect of market analysis that provides insights into the strength and potential direction of price movements. By classifying volume into granular quartiles, traders can quickly understand market sentiment and the underlying momentum of a trading instrument. The color-coded system allows for rapid visual assessment of volume strength, which can be crucial in making informed trading decisions.
The indicator's comprehensive approach helps traders identify potential entry and exit points by revealing subtle changes in market activity. By highlighting volume intensity through different colors and special markers, it transforms complex volume data into an easily interpretable format that can enhance trading strategies across various market conditions.
When to explore it
The Volume Quartile Indicator is most effective in markets with significant trading volume and clear price trends. It works exceptionally well in liquid markets like major stock indices, forex pairs, and high-volume commodities where volume changes can signal meaningful market movements. Traders can use this indicator to confirm trend strength, identify potential reversals, and assess market participation.
The indicator is particularly useful during key market events, earnings releases, and economic announcements when volume dynamics can provide critical insights. It can help traders distinguish between genuine trend movements and potentially false breakouts by offering a nuanced view of volume behavior across different market conditions.
Keep exploring
What we’ve verified
Access, alerts and repainting behaviour have not been independently verified for this indicator. Check the creator’s current publication and settings.
General descriptions and classifications are recovered research. Verified details above identify the specific checks we have completed. Check the creator’s current publication for later changes.