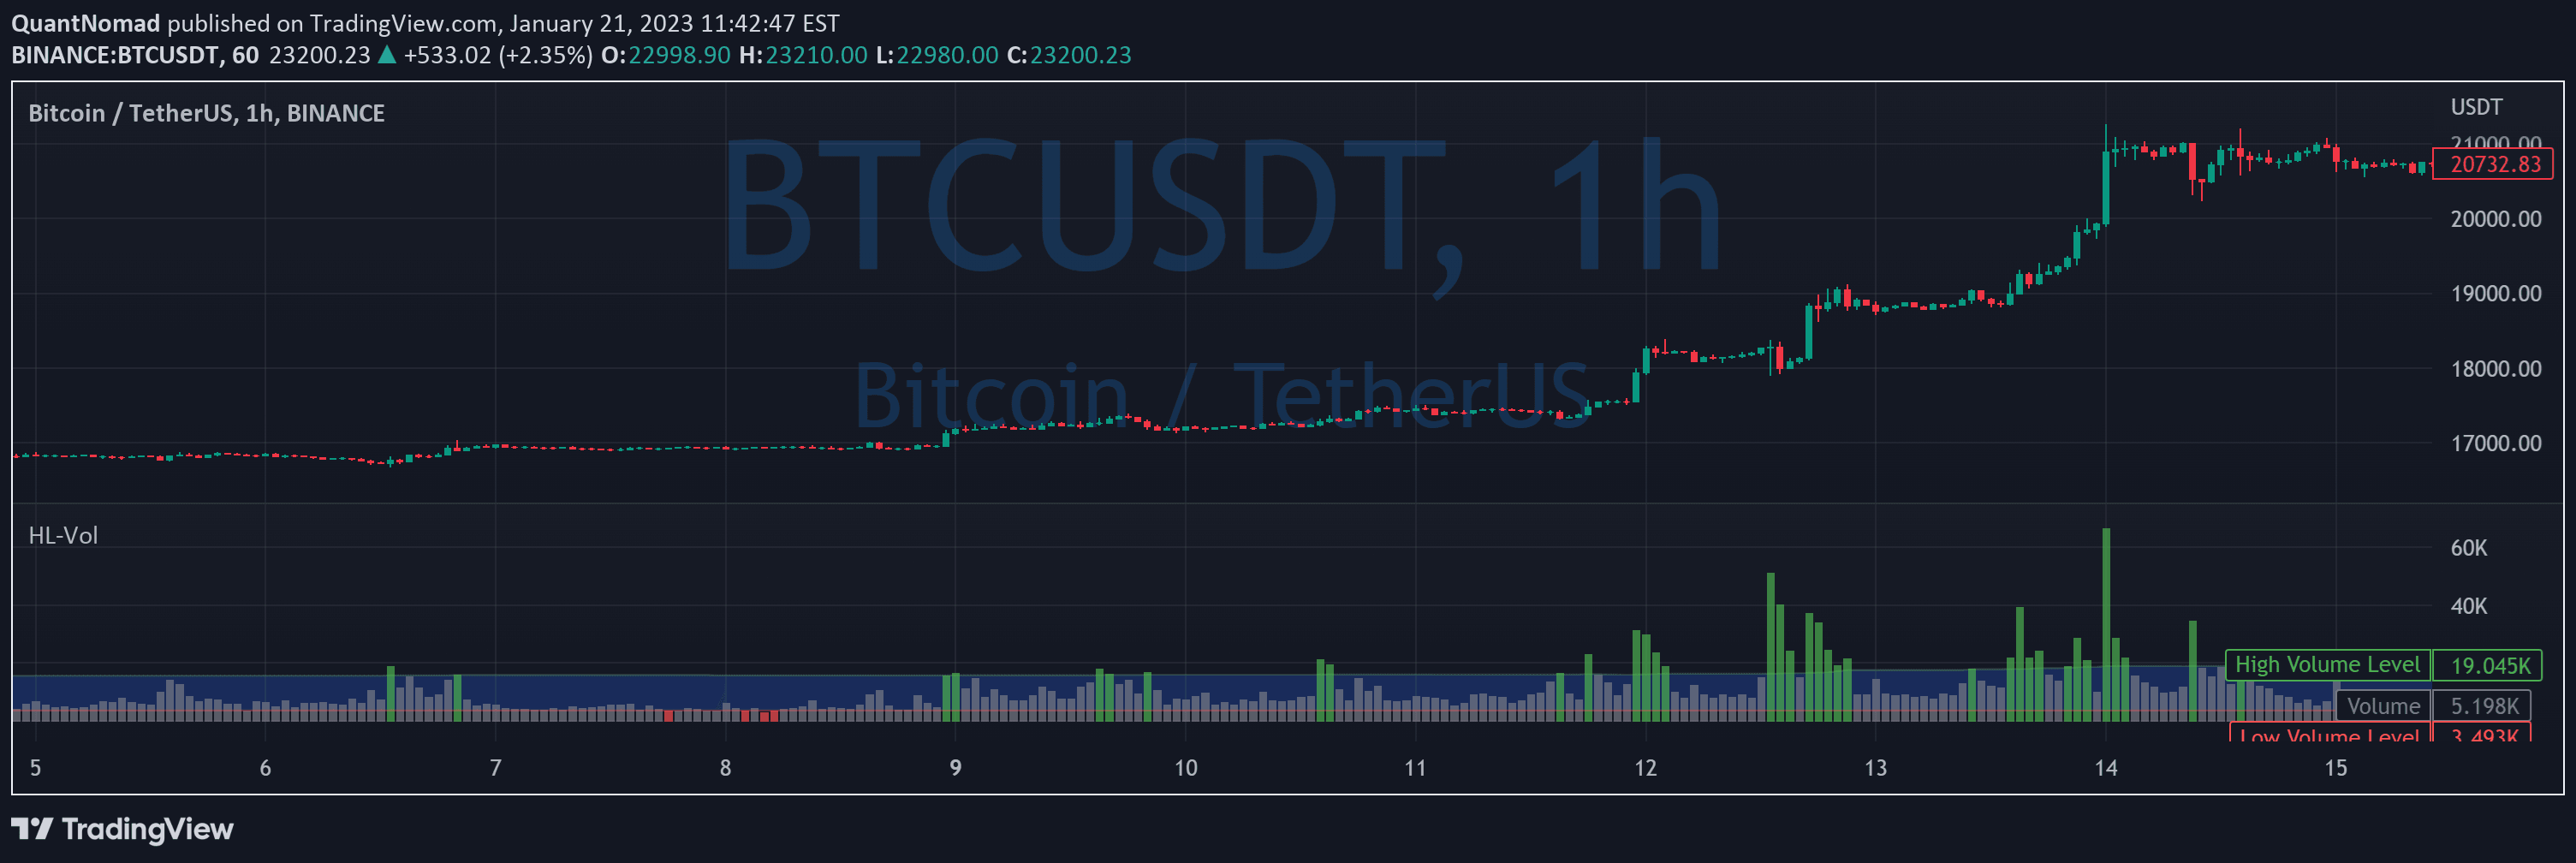
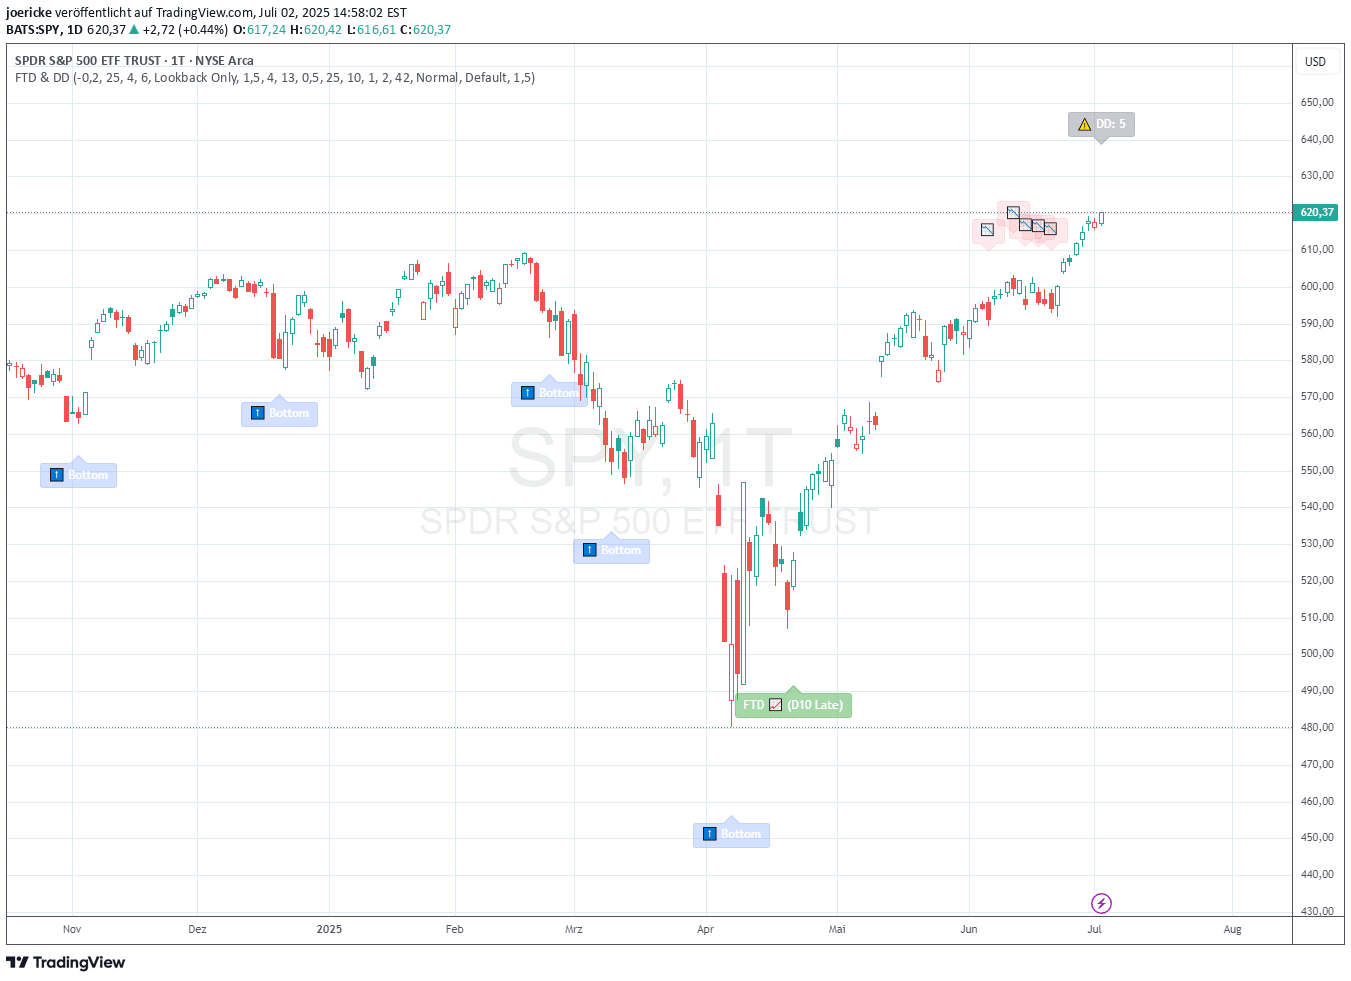
The Volume Spike Indicator identifies significant trading volume changes by comparing current volume to a 10-day average, helping traders recognize potential market trend reversals and shifts in trading activity.
Explore complementary indicator rolesHow it works
The Volume Spike Indicator starts by establishing a baseline average volume over the last 10 days, creating a standard reference point for comparison. It then calculates the percentage change in current trading volume compared to this baseline, identifying significant volume spikes that exceed a predefined threshold.
When the volume exceeds the set percentage (typically 25%), the indicator generates a visual representation of the volume spike. Each spike is plotted as a bar, with the height indicating the magnitude of the volume increase and color-coded to highlight the significance of the volume change.
Why it may be useful
Volume spikes provide critical insights into market dynamics, signaling potential shifts in trader sentiment and momentum that might precede significant price movements. By quantifying and visualizing trading volume variations, traders can gain a deeper understanding of market energy and potential trend reversals.
The indicator helps traders identify moments of heightened market activity, which often correlate with important price transitions. This information can be crucial for making more informed trading decisions, as volume spikes can indicate potential entry or exit points in various market conditions.
When to explore it
The Volume Spike Indicator is most effective in markets with active trading and clear volume patterns, such as stocks, futures, and cryptocurrencies. It works best when combined with other technical analysis tools to confirm potential trend changes and validate trading signals.
Traders should use this indicator during periods of market volatility or when seeking to understand underlying market sentiment. It is particularly useful for identifying potential trend reversals, confirming breakouts, and assessing the strength of current market movements across different timeframes.
Keep exploring
What we’ve verified
Access, alerts and repainting behaviour have not been independently verified for this indicator. Check the creator’s current publication and settings.
General descriptions and classifications are recovered research. Verified details above identify the specific checks we have completed. Check the creator’s current publication for later changes.