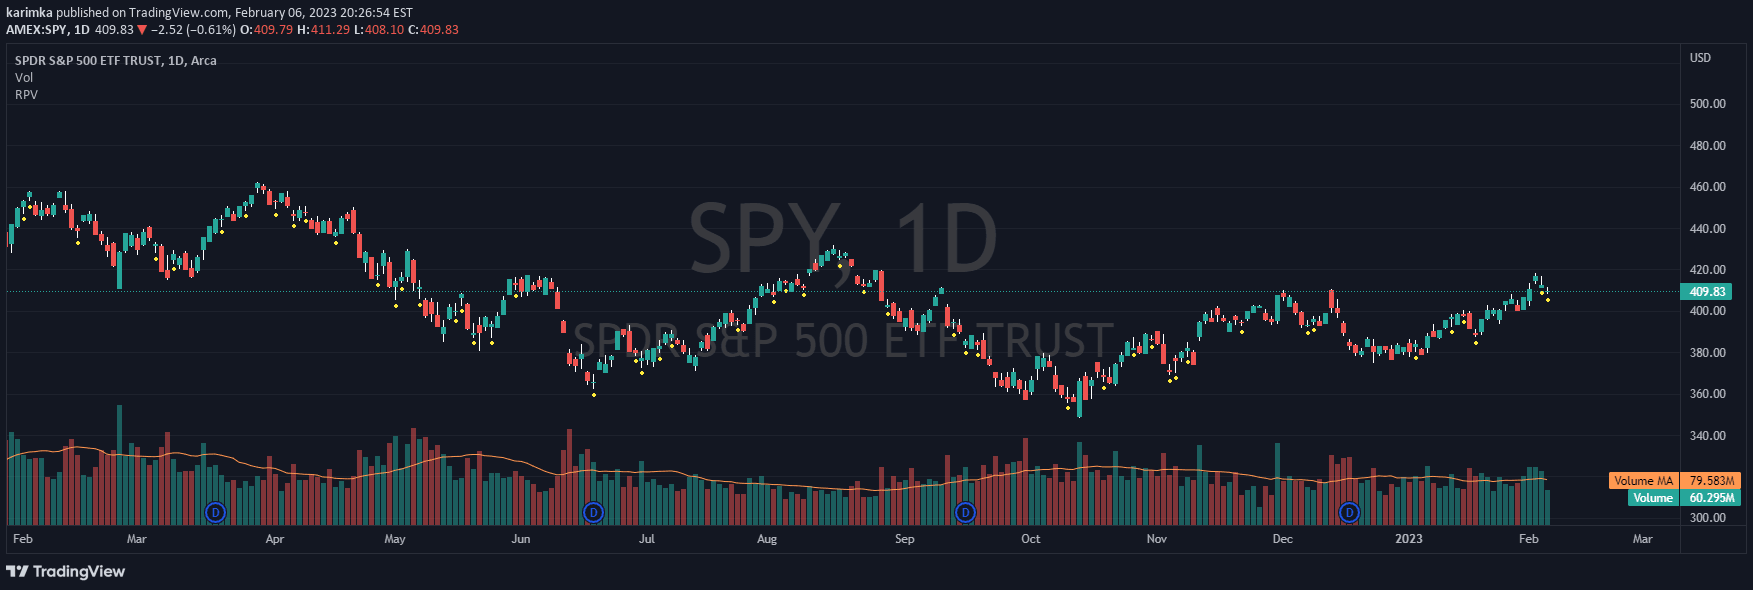
A comprehensive trading indicator that combines relative volume, order flow, VWAP, RSI, and dynamic support/resistance to identify high-probability trading opportunities across multiple market dimensions.
Explore complementary indicator rolesHow it works
The indicator analyzes market dynamics by calculating relative volume zones and comparing current volume to historical averages. It detects high-volume trading areas and identifies order imbalances through Volume Delta and Cumulative Delta analysis.
The system then applies additional filters like RSI and moving average crossovers to validate potential trade signals. It dynamically plots support and resistance levels based on recent price action, providing traders with a multi-dimensional view of market conditions and potential entry or exit points.
Why it may be useful
This comprehensive indicator helps traders make more informed decisions by integrating multiple technical analysis tools into a single, cohesive system. It reduces false signals by cross-referencing volume, order flow, momentum, and price action indicators, ultimately improving trade accuracy and decision-making.
By providing a holistic market view, the indicator allows traders to understand underlying market sentiment and potential price movements more effectively. The multi-layered approach helps identify high-probability trading opportunities that might be missed by using single-indicator strategies.
When to explore it
The indicator is most effective on shorter timeframes like M5 and M15, making it ideal for scalping and day trading strategies. It works best in markets with clear volume patterns and active order flow, such as liquid stocks, forex pairs, and futures contracts.
Traders should use this indicator when seeking to confirm market trends, identify potential reversals, and understand underlying market dynamics. It is particularly useful during periods of high market activity and when traders want a comprehensive, multi-dimensional analysis of price and volume interactions.
Keep exploring
What we’ve verified
Access, alerts and repainting behaviour have not been independently verified for this indicator. Check the creator’s current publication and settings.
General descriptions and classifications are recovered research. Verified details above identify the specific checks we have completed. Check the creator’s current publication for later changes.