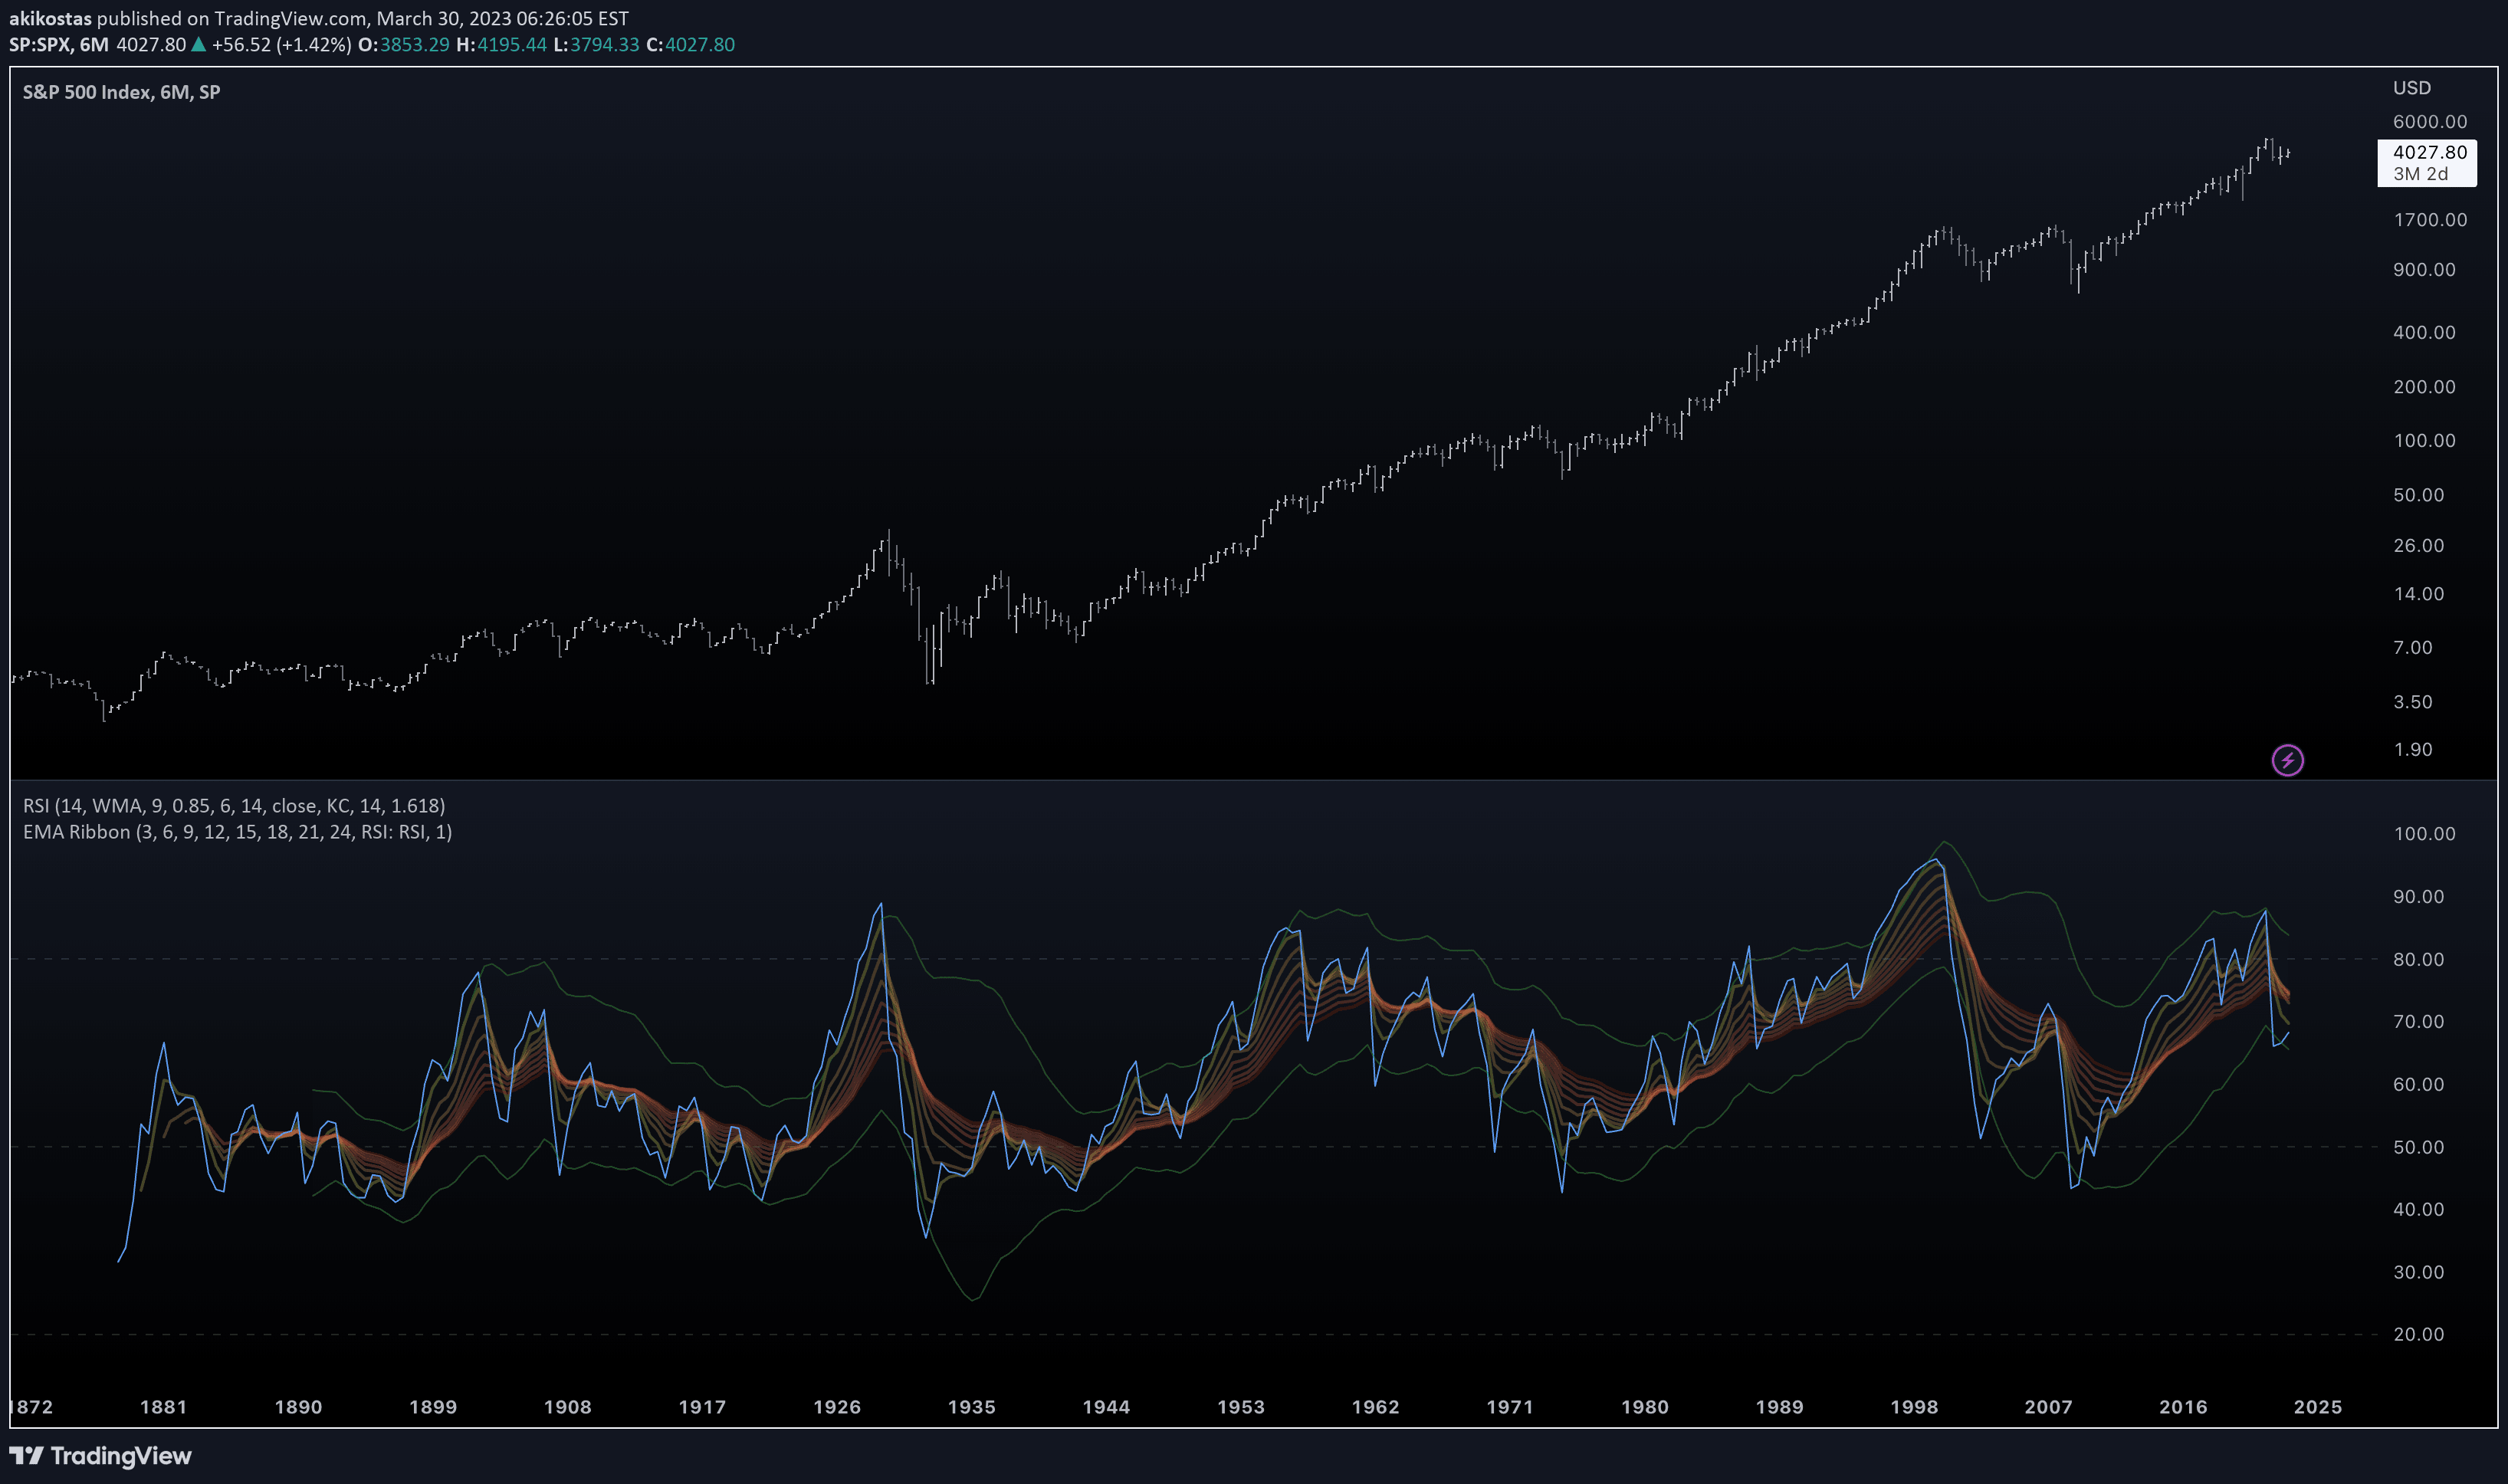
A custom RSI-based indicator that creates Bollinger Bands-style signals by reversing RSI calculations to predict potential price movements across different RSI levels.
Explore complementary indicator rolesHow it works
The Reverse Double Smoothed Relative Strength Index Bands works by calculating a reverse RSI formula for multiple RSI levels, creating a unique visualization of potential price movements. It generates multiple lines that represent different RSI thresholds, effectively mapping out potential price scenarios based on oscillator dynamics.
The indicator uses color-coding to highlight signal strength, with darker colors indicating stronger signals and lighter colors representing more typical market conditions. Traders can interpret buy signals when lines turn green and sell signals when lines turn red, providing a nuanced approach to momentum analysis.
Why it may be useful
This indicator offers traders a sophisticated way to understand potential price reversals and momentum shifts by providing a multi-dimensional view of RSI performance. By mapping out potential price scenarios across different RSI levels, traders can gain deeper insights into market dynamics and potential trend changes.
The color-coded system allows for quick visual interpretation of signal strength, helping traders make more informed decisions about entry and exit points. Its unique approach of reversing traditional RSI calculations provides a fresh perspective on momentum analysis that can complement other technical indicators.
When to explore it
The Reverse Double Smoothed Relative Strength Index Bands is most effective in markets with clear momentum trends and moderate volatility. It works best for traders who want a more nuanced view of potential price movements beyond traditional RSI interpretations.
Traders should consider using this indicator during periods of consistent market movement, particularly in assets with predictable oscillator behavior. It is particularly useful for short to medium-term trading strategies, offering insights that can help refine entry and exit decisions across different market conditions.
Keep exploring
What we’ve verified
Access, alerts and repainting behaviour have not been independently verified for this indicator. Check the creator’s current publication and settings.
General descriptions and classifications are recovered research. Verified details above identify the specific checks we have completed. Check the creator’s current publication for later changes.