
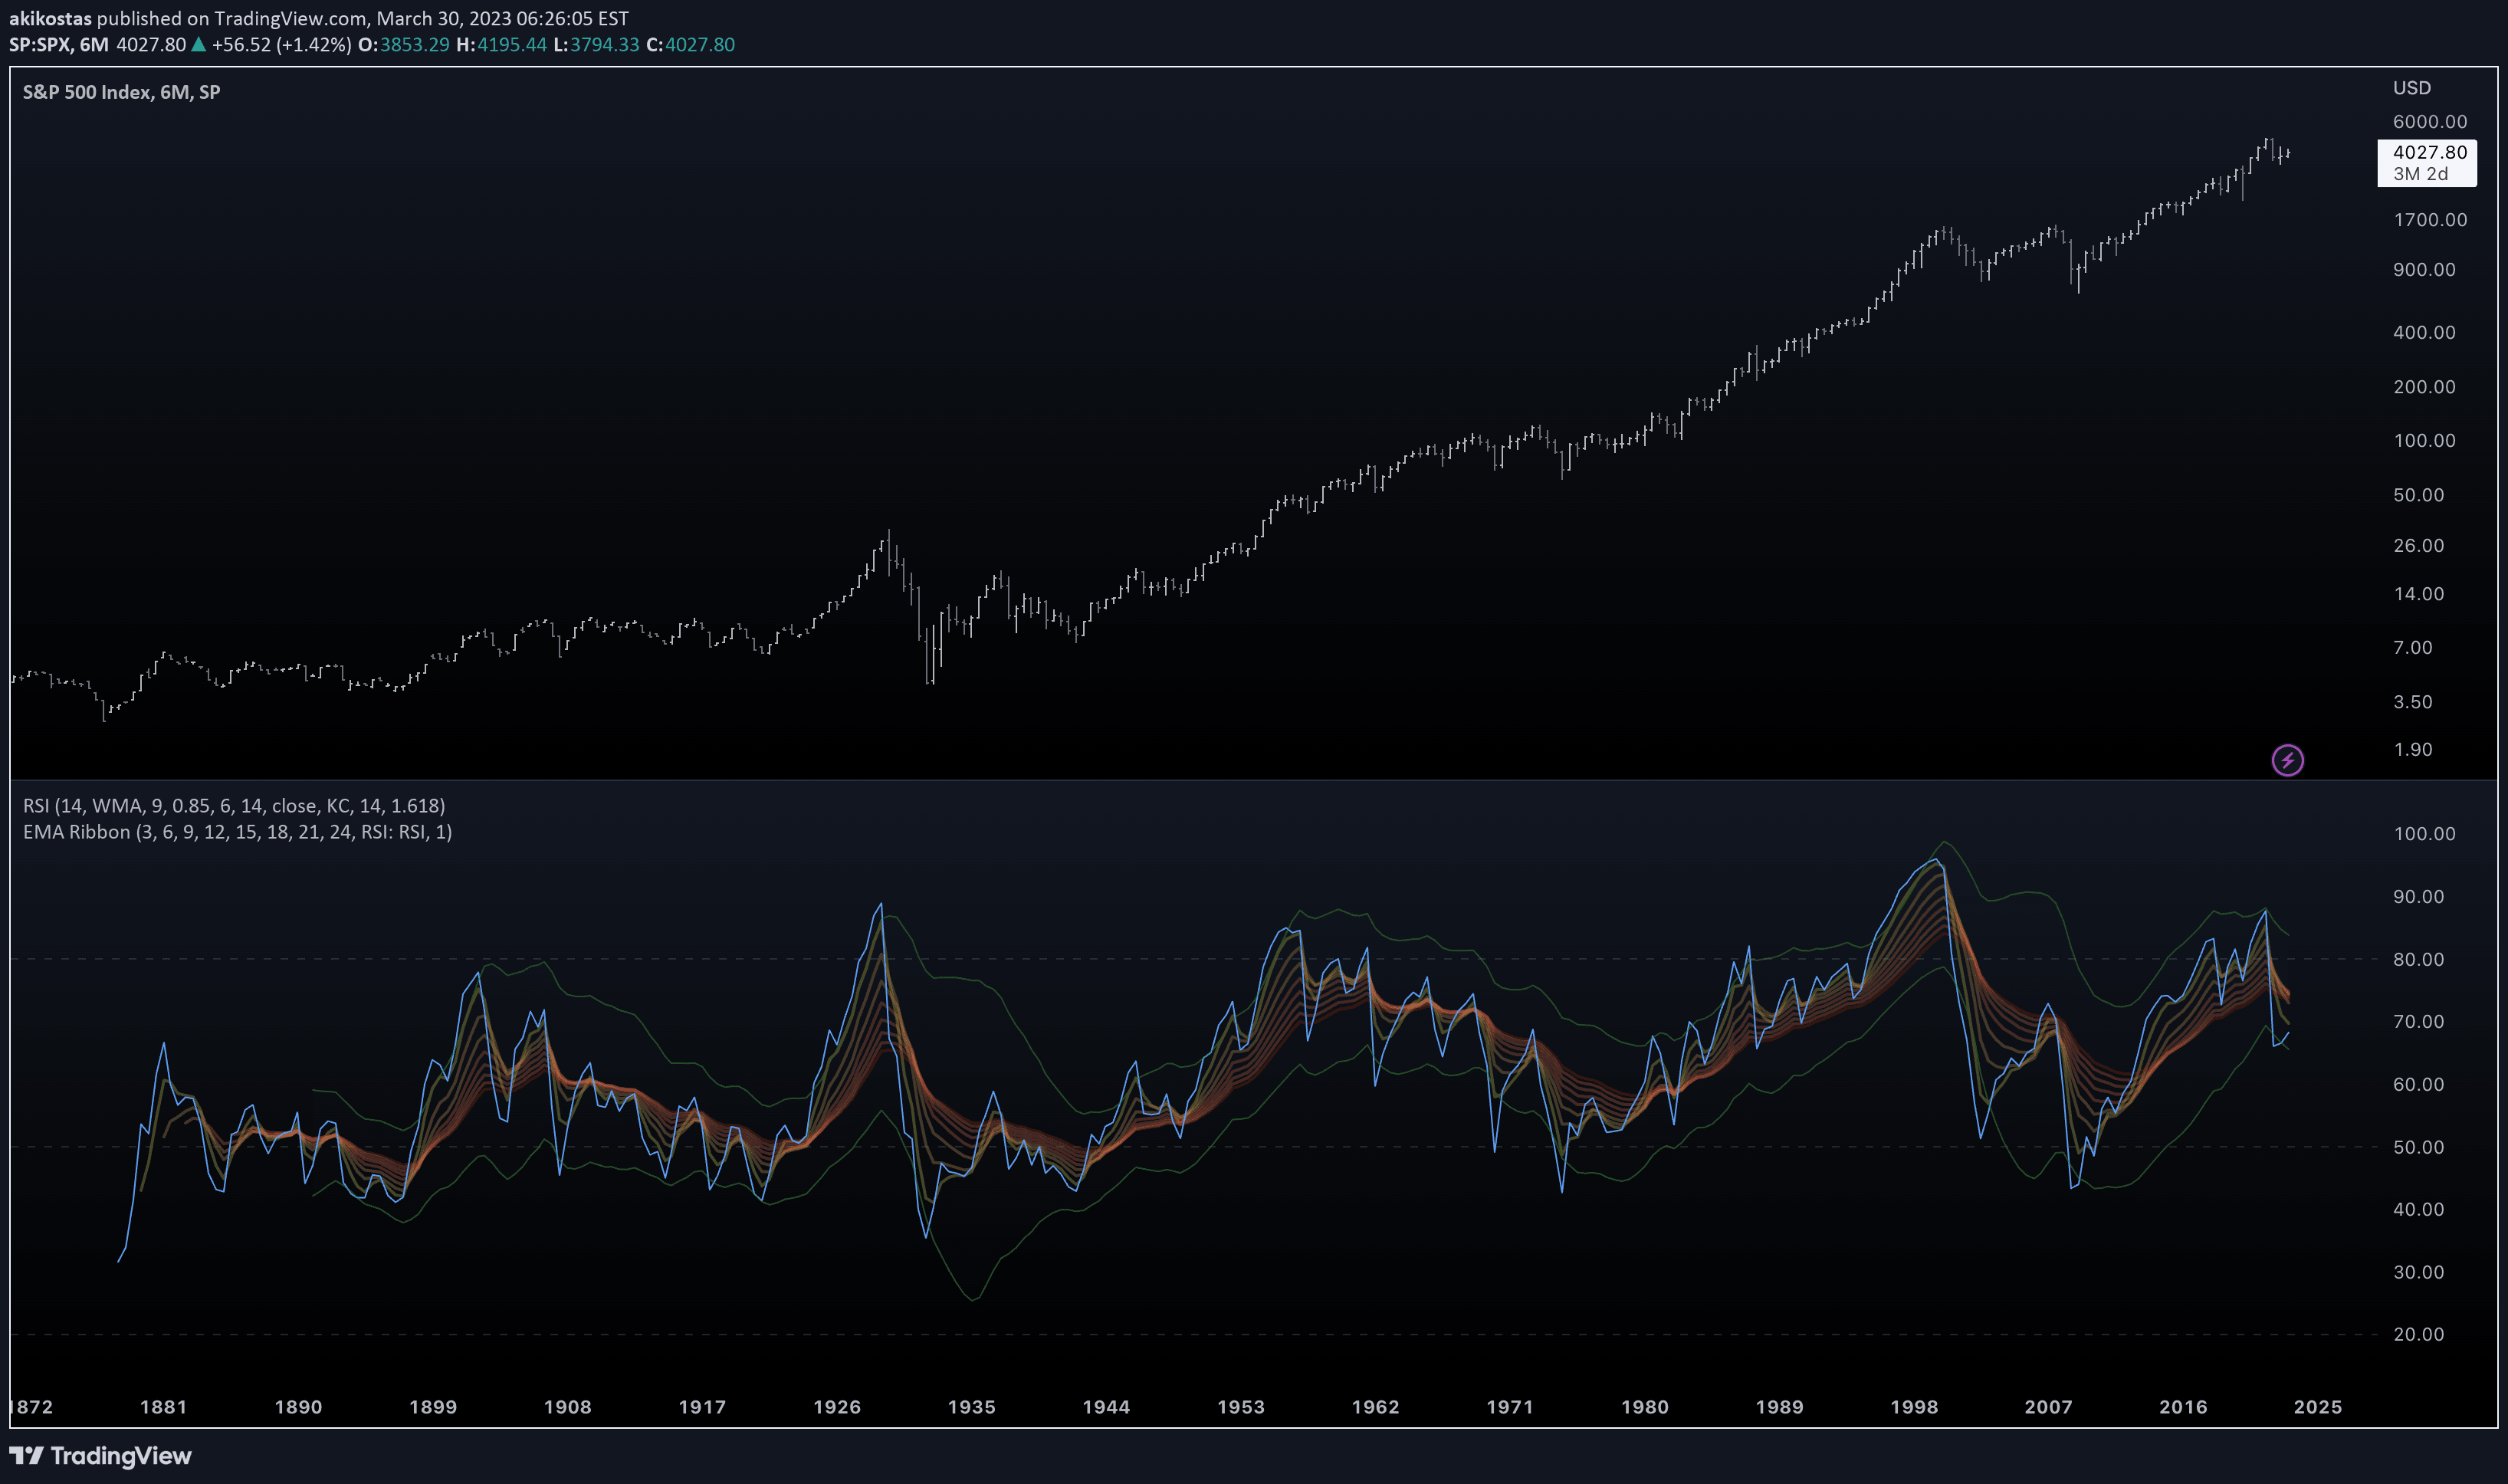
A custom RSI indicator enhanced with Keltner Channels to provide advanced insights into market momentum and potential overbought/oversold conditions beyond traditional RSI levels.
Explore complementary indicator rolesHow it works
The custom RSI with Keltner Channels combines the Relative Strength Index (RSI) with Keltner Channel bands to create a more nuanced momentum analysis. By overlaying Keltner Channels around the RSI, the indicator provides dynamic boundaries that help traders identify potential market extremes and momentum shifts.
Unlike traditional RSI which uses fixed 20-80 levels, this approach uses the Keltner Channels to dynamically represent overbought and oversold conditions. The channels adapt to market volatility, offering a more responsive and context-aware method of interpreting momentum and potential trend reversals.
Why it may be useful
This custom RSI with Keltner Channels offers traders a more sophisticated approach to momentum analysis by combining multiple analytical techniques. The indicator helps overcome the limitations of standard RSI by providing adaptive, context-sensitive insights into market conditions and potential trend changes.
By integrating Keltner Channels, traders gain a more dynamic tool for identifying potential entry and exit points. The enhanced visualization allows for more nuanced interpretation of market momentum, helping traders make more informed decisions based on both price movement and volatility.
When to explore it
The custom RSI with Keltner Channels is most effective in markets with clear momentum trends and moderate to high volatility. It performs particularly well in identifying potential trend reversals and momentum shifts across different timeframes and asset classes.
Traders should use this indicator in conjunction with other technical analysis tools to confirm signals and reduce false positives. It is especially useful in markets like stocks, forex, and cryptocurrencies where momentum and quick trend changes are common.
Keep exploring
What we’ve verified
Access, alerts and repainting behaviour have not been independently verified for this indicator. Check the creator’s current publication and settings.
General descriptions and classifications are recovered research. Verified details above identify the specific checks we have completed. Check the creator’s current publication for later changes.


