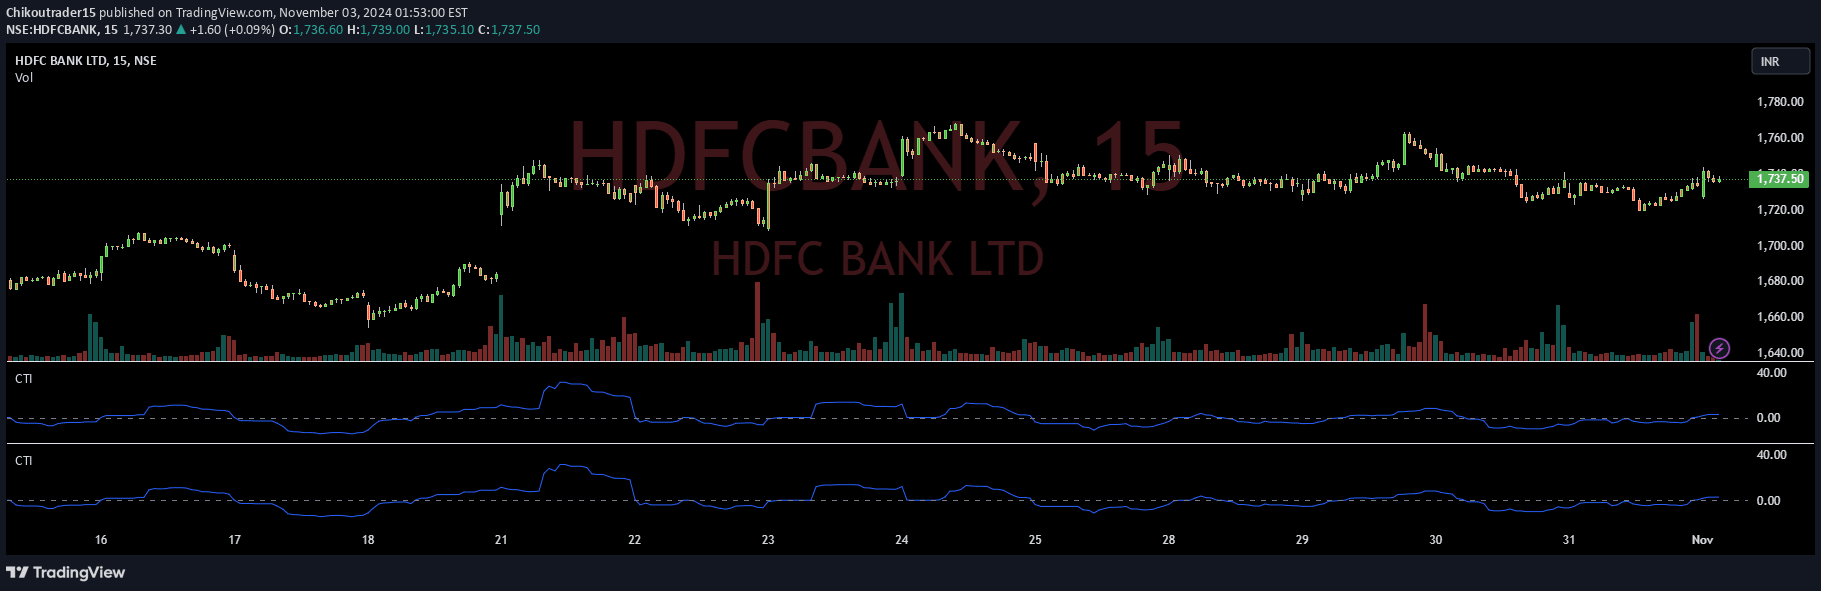
The RMVH indicator combines RSI, MACD, Volume, and Smoothed Heiken Ashi to provide a comprehensive market analysis tool for identifying trends, momentum, and potential trading signals.
Explore complementary indicator rolesHow it works
The RMVH indicator integrates multiple technical analysis tools to generate a comprehensive market assessment. The Relative Strength Index (RSI) measures price movement strength by oscillating between 0 and 100, with values above 70 indicating overbought conditions and below 30 suggesting oversold scenarios.
The MACD component tracks momentum by comparing short-term and long-term moving averages, generating signals through the relationship between the MACD line and signal line. Volume analysis provides additional context by measuring trading activity, while the Smoothed Heiken Ashi technique filters market noise to create clearer trend visualizations.
Why it may be useful
The RMVH indicator offers traders a multi-dimensional view of market conditions by combining different analytical perspectives. By integrating momentum, trend, volume, and price action indicators, traders can gain deeper insights into potential market movements and make more informed trading decisions.
This comprehensive approach helps traders identify potential trend reversals, assess market strength, and validate trading signals across different market conditions. The indicator's versatility allows for more nuanced analysis compared to single-indicator strategies, reducing the risk of false signals and improving overall trading accuracy.
When to explore it
The RMVH indicator is most effective in markets with clear directional movements and moderate to high trading volumes. Traders should prioritize using this indicator during periods of consistent price trends, where momentum and volume can provide reliable confirmation of market direction.
It is particularly useful in volatile markets where multiple technical indicators can help validate potential entry and exit points. Traders should combine the RMVH indicator with other analytical tools and fundamental research to enhance its effectiveness and minimize potential false signals.
Keep exploring
What we’ve verified
Access, alerts and repainting behaviour have not been independently verified for this indicator. Check the creator’s current publication and settings.
General descriptions and classifications are recovered research. Verified details above identify the specific checks we have completed. Check the creator’s current publication for later changes.