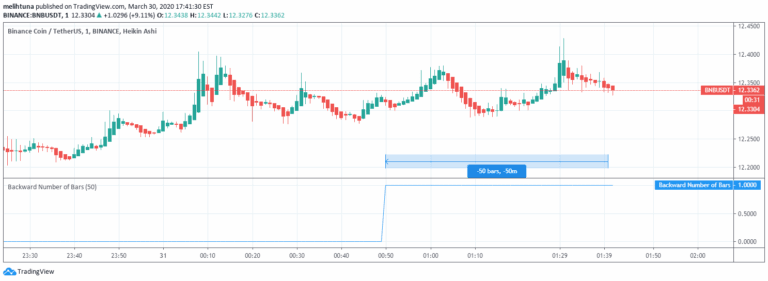
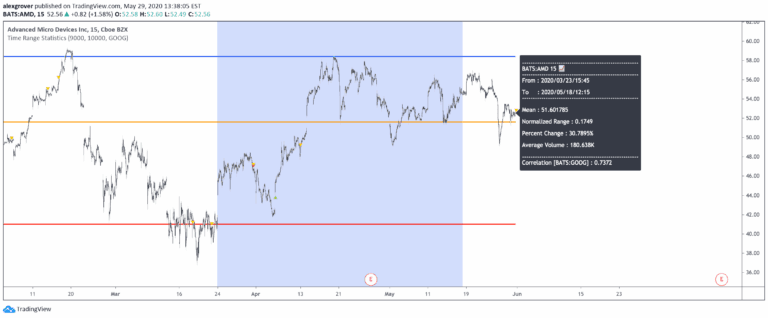
A specialized tool designed to analyze and extract statistical insights from bar patterns in trading, helping traders understand historical price movement characteristics and potential future trends.
Explore complementary indicator rolesHow it works
The bar pattern mining tool systematically collects and processes historical price bar data to identify recurring patterns and statistical characteristics. It examines various attributes such as bar length, color, relationship between open and close prices, and sequential arrangements.
By applying advanced statistical algorithms, the tool categorizes and quantifies these patterns, revealing underlying market behaviors. The analysis involves computing frequency distributions, correlation coefficients, and probability metrics for different bar configurations. This comprehensive approach allows traders to understand nuanced price movement dynamics beyond simple visual pattern recognition
Why it may be useful
Statistical bar pattern mining provides traders with objective, data-driven insights into market behavior that transcend subjective visual interpretations. By quantifying historical price movements, traders can develop more robust trading strategies grounded in empirical evidence.
The tool helps identify subtle market tendencies that might be overlooked through traditional chart analysis. It enables more precise risk management by understanding the statistical likelihood of specific price movements. Traders can use these insights to validate trading hypotheses, improve entry and exit strategies, and develop more systematic approach to market analysis
When to explore it
Bar pattern mining is most effective in markets with consistent liquidity and established trading histories. It works best for liquid instruments like major forex pairs, large-cap stocks, and prominent index futures. The tool is particularly valuable during periods of stable market conditions where historical patterns are more likely to repeat.
Traders should apply this analysis across multiple timeframes to validate findings and reduce false signals. It is especially useful for developing long-term trading strategies, creating trading algorithms, and understanding market microstructure. The tool becomes increasingly powerful when combined with other technical and fundamental analysis techniques
Keep exploring
What we’ve verified
Access, alerts and repainting behaviour have not been independently verified for this indicator. Check the creator’s current publication and settings.
General descriptions and classifications are recovered research. Verified details above identify the specific checks we have completed. Check the creator’s current publication for later changes.