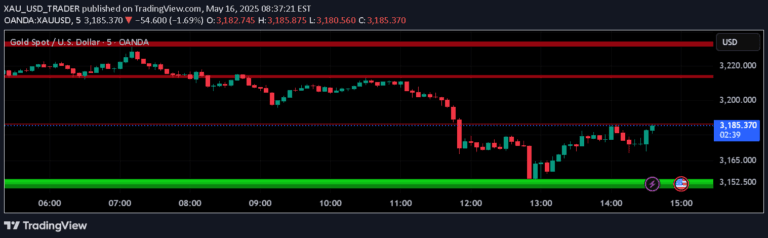
A customizable RSI indicator that provides consistent calculations across platforms by offering EMA or SMA smoothing options for analyzing price momentum and potential trend reversals.
Explore complementary indicator rolesHow it works
The Classic RSI calculates the relative strength of price movements by comparing upward and downward price changes over a specific period. It computes the ratio of average gains to average losses, then transforms this into an oscillating value between 0 and 100 using a smoothing technique like EMA or SMA.
The indicator allows traders to choose between Exponential Moving Average (EMA) or Simple Moving Average (SMA) for smoothing gains and losses, providing flexibility in calculation methods. By tracking the momentum of price changes, the RSI helps identify potential overbought or oversold conditions, with traditional levels at 70 (overbought) and 30 (oversold) signaling potential trend reversals.
Why it may be useful
The RSI is crucial for traders because it provides a standardized method of measuring price momentum and potential trend exhaustion. By quantifying the speed and magnitude of price movements, traders can gain insights into market sentiment and potential reversal points, which are essential for making informed trading decisions.
This specific implementation's cross-platform consistency is particularly valuable, as it allows traders to align RSI calculations across different programming languages and trading platforms. The ability to choose between EMA and SMA smoothing techniques provides additional flexibility, enabling traders to adapt the indicator to their specific trading strategy and market conditions.
When to explore it
The Classic RSI works best in trending and range-bound markets where momentum shifts are significant. In strong trending markets, traders can use the RSI to identify potential pullback or continuation points, looking for divergences between price action and the indicator's movement. During range-bound conditions, the overbought and oversold levels become particularly useful for timing entry and exit points.
Traders should be most cautious when using RSI in highly volatile or choppy markets, where momentum signals might generate false readings. The indicator is most effective when combined with other technical analysis tools, such as trend lines, support and resistance levels, or complementary momentum indicators, to confirm potential trading signals and reduce false positive scenarios.
Keep exploring
What we’ve verified
Access, alerts and repainting behaviour have not been independently verified for this indicator. Check the creator’s current publication and settings.
General descriptions and classifications are recovered research. Verified details above identify the specific checks we have completed. Check the creator’s current publication for later changes.