
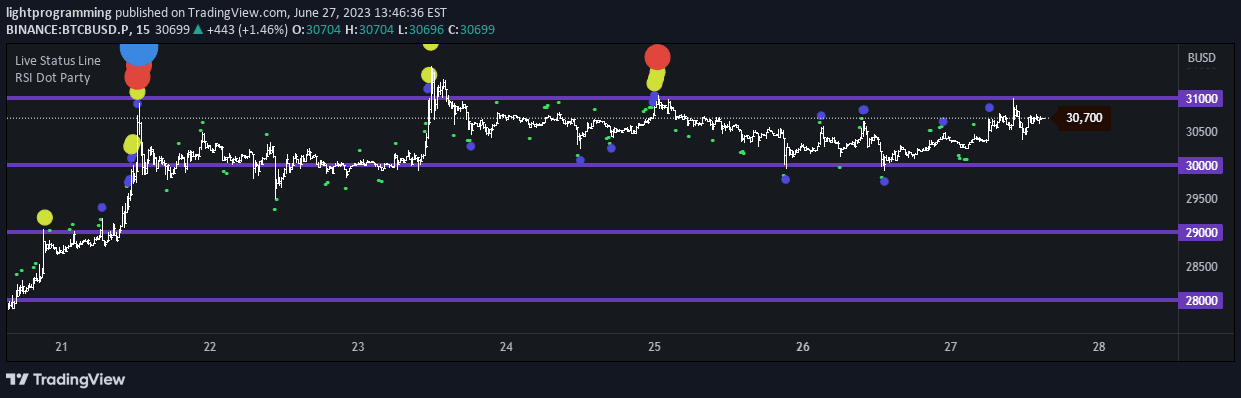
RSI Dot Party indicator displays multiple RSI lengths as colored dots, revealing potential price reversals across different timeframes and helping traders identify trend changes.
Explore complementary indicator rolesHow it works
The RSI Dot Party indicator calculates RSI values across 1-120 lengths, generating colored dots when specific RSI boundaries are crossed. Each dot represents a potential price reversal point, with dot size indicating the strength of the potential reversal signal.
The indicator uses multiple color groups to differentiate RSI ranges, allowing traders to quickly visualize RSI behavior across various timeframes. By displaying dots when RSI crosses predefined boundaries, traders can identify potential trend changes and market momentum shifts.
Why it may be useful
The RSI Dot Party provides a comprehensive view of market momentum by simultaneously tracking multiple RSI lengths and displaying their potential reversal points. This multi-dimensional approach allows traders to gain deeper insights into market dynamics that might be missed by traditional single-length RSI indicators.
By offering customizable settings and visual dot representations, the indicator helps traders quickly identify potential entry and exit points across different market conditions. The color-coded system enables rapid pattern recognition and supports more informed trading decisions.
When to explore it
The RSI Dot Party works best in markets with clear trending or ranging conditions, where price momentum can be effectively measured across multiple timeframes. Traders can optimize the indicator by adjusting boundary settings to match specific asset characteristics and trading styles.
This indicator is particularly useful during volatile market periods, when rapid trend changes and momentum shifts are more likely to occur. By providing a multi-length RSI perspective, traders can develop more nuanced strategies for capturing potential market reversals.
Keep exploring
What we’ve verified
Access, alerts and repainting behaviour have not been independently verified for this indicator. Check the creator’s current publication and settings.
General descriptions and classifications are recovered research. Verified details above identify the specific checks we have completed. Check the creator’s current publication for later changes.


