D-Shape Breakout Signals [LuxAlgo]
D-Shape Breakout Signals is an innovative indicator that uses semi-circular arcs to identify potential support/resistance levels and generate breakout signals with a trailing stop-loss mechanism.
Explore 11,183 indicators. Filter beyond the obvious.
Discover the tools that fit the way you trade.
11,183 tools to explore
D-Shape Breakout Signals is an innovative indicator that uses semi-circular arcs to identify potential support/resistance levels and generate breakout signals with a trailing stop-loss mechanism.
A multi-faceted crypto trading indicator that tracks liquidation ranges, volume/OI dots, and identifies high-volume price areas using advanced volume and open interest analysis.
A Half Cup indicator that detects potential trading opportunities by identifying partial cup patterns and tracking channel breakouts with visual dot markers.
Price Volume Scatter Plot is an advanced visualization tool that maps intrabar price and volume data, revealing detailed trading behavior across price levels using a comprehensive scatter representation.
A dynamic support and resistance dashboard that visualizes market cycle shifts through dot indicators tracking key technical levels like Ichimoku Cloud and ZLEMA across different price zones.
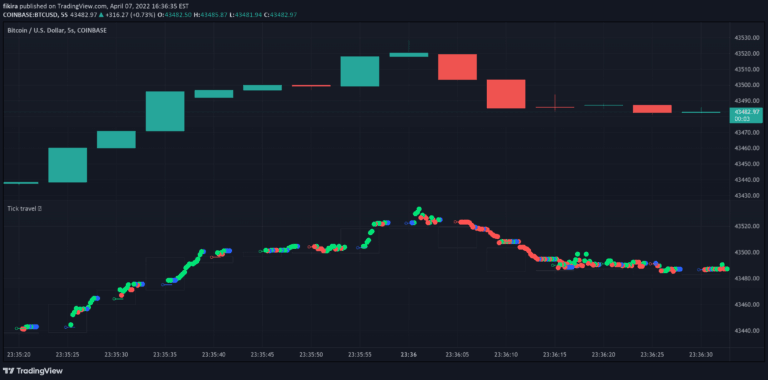
A trading signal that tracks and visualizes price changes through tick-based markers, showing price movement progression during active trading with color-coded indicators.
A practical trading indicator that identifies overbought and oversold market conditions, helping traders make informed entry and exit decisions across various timeframes.
A dynamic trend-following indicator using Kaufman's Adaptive Moving Average with Gaussian smoothing and ATR-based breakout logic for responsive market analysis.
The Buffett Valuation Indicator assesses stock market valuation by comparing total market capitalization to GDP, using Bollinger Bands to identify overvalued or undervalued market conditions.
A comprehensive options volatility analysis tool that evaluates market conditions through historical volatility metrics, benchmarking, and regime detection to guide strategic options trading decisions.
A dynamic trendline indicator that detects market pivot points using volume-confirmed breakouts, helping traders identify potential trend reversals and significant price movements.
A trading indicator that estimates future price ranges by analyzing price volatility within a rolling window, helping traders predict potential price movements and market range.
Likes, views, and comments are historical TradingView snapshots. They describe attention, not trading performance.