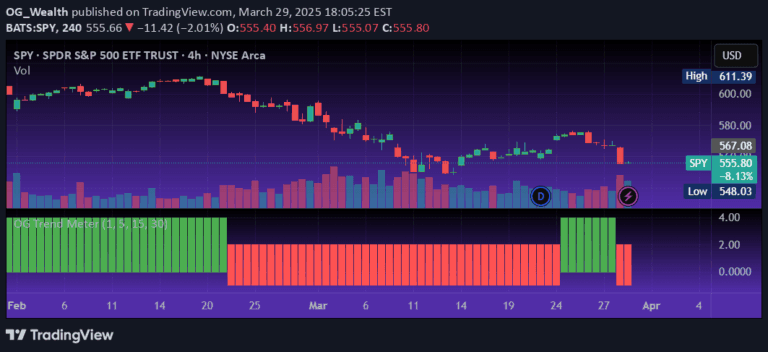
A custom RSI indicator using Heikin-Ashi candle representation with advanced smoothing techniques and multi-timeframe analysis to enhance momentum signal clarity and trend interpretation.
Explore complementary indicator rolesHow it works
The indicator calculates RSI using Wilder's Moving Average with customizable period and price source, then transforms the RSI data into Heikin-Ashi style candles through a unique double EMA smoothing method. It applies a 5-period EMA to recalculate the HA Close, HA Open, HA High, and HA Low, creating a more dynamic and smoother representation of momentum.
Additionally, the script retrieves the 1-hour timeframe RSI and overlays a 50-period EMA to provide multi-timeframe context and trend confirmation. The resulting visualization offers a color-coded candle representation of RSI momentum, with standard RSI bands at 30, 50, and 70 to help traders identify potential trend shifts and market conditions.
Why it may be useful
Traditional RSI indicators often present noisy and less intuitive signals, making it challenging for traders to quickly interpret momentum changes. This custom indicator addresses this limitation by transforming RSI into a more readable Heikin-Ashi candle format, which provides a clearer visual representation of momentum trends and potential reversals.
By incorporating multi-timeframe analysis and advanced smoothing techniques, the indicator offers traders a more comprehensive view of market momentum. The color-coded candles and EMA overlay help identify trend strength, potential entry and exit points, and provide a more nuanced understanding of market dynamics compared to standard RSI plots.
When to explore it
This indicator is most effective in markets with clear trending or range-bound conditions, where momentum signals can provide valuable insights into potential price movements. Traders can leverage the HA RSI candles to identify early momentum shifts, confirm trend changes through EMA crossovers, and spot potential overbought or oversold conditions.
The multi-timeframe comparison is particularly useful for traders seeking to align their strategies across different time horizons, such as intraday and swing trading. By comparing the chart timeframe and 1-hour HA RSI, traders can make more informed decisions and increase the probability of successful trade entries and exits.
Keep exploring
What we’ve verified
Access, alerts and repainting behaviour have not been independently verified for this indicator. Check the creator’s current publication and settings.
General descriptions and classifications are recovered research. Verified details above identify the specific checks we have completed. Check the creator’s current publication for later changes.