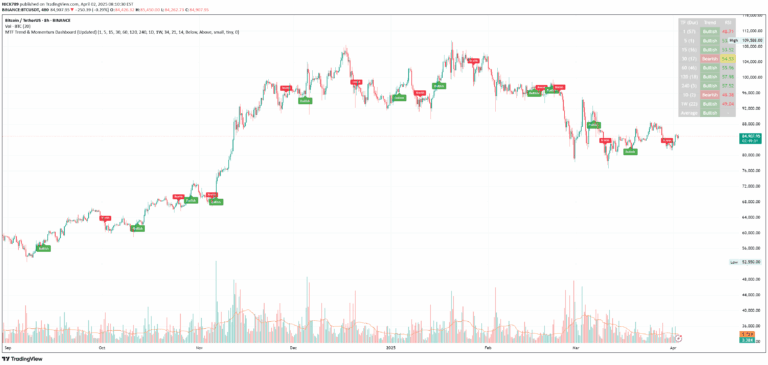
The RSI of a Zero Lag Moving Average combines momentum analysis with reduced indicator lag, providing precise exit signals by identifying overbought and oversold market conditions.
Explore complementary indicator rolesHow it works
The RSI of a Zero Lag Moving Average integrates two powerful technical analysis tools: the Relative Strength Index (RSI) and the Zero Lag Moving Average. The RSI measures price momentum by calculating the magnitude of recent price changes, oscillating between 0 and 100 to identify potential overbought or oversold conditions.
The Zero Lag Moving Average complements the RSI by minimizing computational delays, providing a more responsive representation of price movement. By combining these indicators, traders can generate more accurate exit signals that reflect current market dynamics with enhanced precision and reduced latency.
Why it may be useful
This indicator offers traders a sophisticated method for identifying market turning points and optimizing trade exits with greater accuracy. By integrating momentum analysis with a lag-minimized moving average, traders can make more informed decisions about when to close positions.
The combination provides objective, quantifiable signals that help traders overcome emotional decision-making and rely on mathematical principles. It allows for more precise market timing, potentially reducing unnecessary trade losses and improving overall trading strategy effectiveness.
When to explore it
The RSI of a Zero Lag Moving Average works best in markets with clear momentum shifts and during periods of identifiable trend reversals. It is particularly effective in volatile markets where quick, responsive signals can help traders capitalize on short-term price movements.
Traders should consider using this indicator in various market conditions, including ranging, trending, and transitional markets. It is especially valuable when seeking to confirm potential trend changes, manage risk, and identify optimal exit points across different trading timeframes.
Keep exploring
What we’ve verified
Access, alerts and repainting behaviour have not been independently verified for this indicator. Check the creator’s current publication and settings.
General descriptions and classifications are recovered research. Verified details above identify the specific checks we have completed. Check the creator’s current publication for later changes.