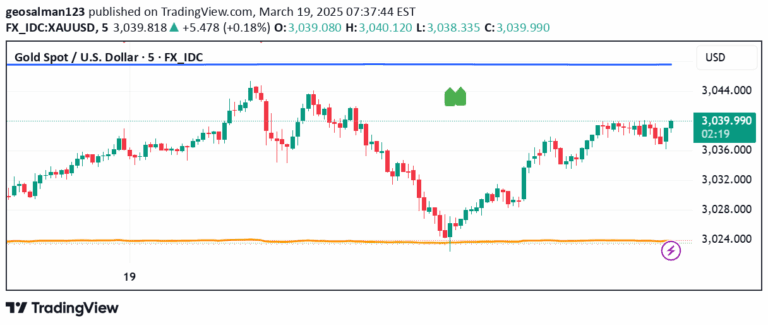
A dynamic RSI-based trading indicator that uses Stochastic RSI and moving averages to identify market momentum and trend direction through color-coded candles.
Explore complementary indicator rolesHow it works
The RSI Trend indicator operates by utilizing Stochastic RSI, a sophisticated derivative of the standard RSI that provides more precise momentum measurements. It calculates two smoothed moving averages based on the Stochastic RSI values, creating a dynamic representation of market trends.
These moving averages are then used to determine the current market momentum, with their relative positions triggering color changes in chart candles. When the faster moving average crosses above the slower one, candles turn blue, indicating bullish momentum, while orange candles signal bearish momentum, offering traders an intuitive visual interpretation of market conditions.
Why it may be useful
This indicator simplifies complex market analysis by transforming abstract momentum calculations into easy-to-understand visual signals. By integrating Stochastic RSI with moving averages, traders can quickly identify trend shifts and potential trading opportunities without extensive technical analysis.
The color-coded candle system provides an immediate, intuitive understanding of market dynamics, reducing the cognitive load of interpreting multiple technical indicators. Its adaptability and dynamic scaling make it valuable for traders across different experience levels and trading styles, offering a streamlined approach to trend identification.
When to explore it
The RSI Trend indicator is most effective in markets with clear trending characteristics, such as forex, stocks, and cryptocurrency markets. It performs exceptionally well in timeframes ranging from short-term (minutes) to medium-term (daily) charts, providing reliable momentum insights.
Traders should optimize its use by combining it with complementary tools like trendlines, support and resistance levels, and volume analysis. It is particularly useful during periods of sustained market movement, helping traders confirm trend strength and potential reversal points across various market conditions and asset classes.
Keep exploring
What we’ve verified
Access, alerts and repainting behaviour have not been independently verified for this indicator. Check the creator’s current publication and settings.
General descriptions and classifications are recovered research. Verified details above identify the specific checks we have completed. Check the creator’s current publication for later changes.