
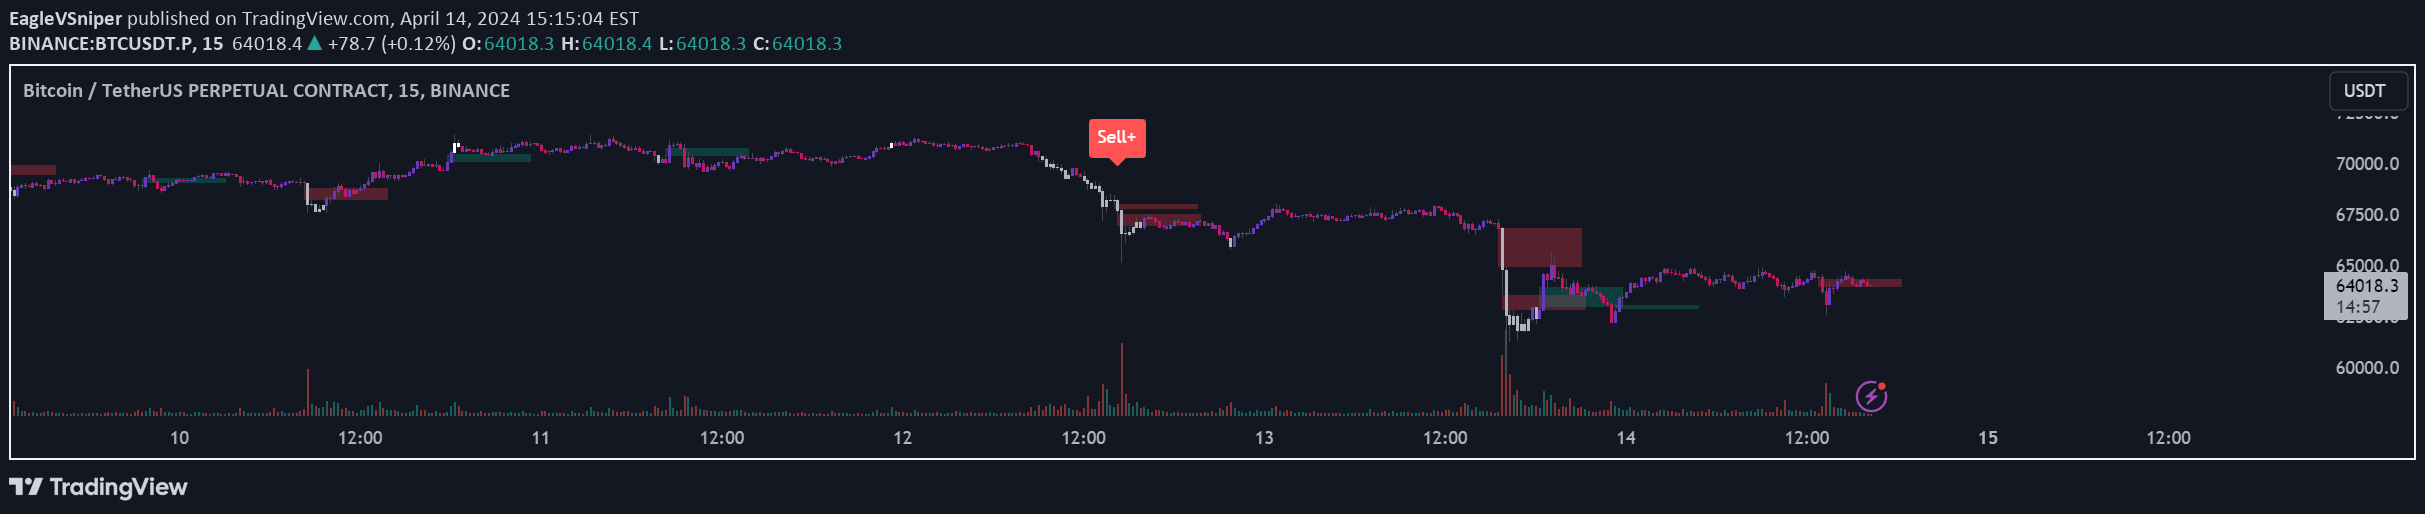
A TradingView script combining RSI trend analysis with Fair Value Gap detection to identify potential trading opportunities using technical indicators and price action gaps.
Explore complementary indicator rolesHow it works
The script first detects Fair Value Gaps (FVGs) by analyzing price action and identifying significant market imbalances. It simultaneously calculates the Relative Strength Index (RSI) to assess market momentum and potential overbought or oversold conditions.
Using these two technical analysis methods, the script generates buy and sell signals with different confirmation levels. The signals are created by comparing RSI readings against predefined thresholds and checking for the presence or absence of specific types of Fair Value Gaps in the market structure.
Why it may be useful
Technical traders benefit from this script's ability to combine multiple analytical approaches, providing a more comprehensive view of potential market opportunities. By integrating price action analysis through FVGs with momentum indicators like RSI, traders can make more informed decisions about market entry and exit points.
The multi-layered signal system allows traders to customize their risk tolerance and trading strategy. Different signal levels (Buy, Buy+, Buy++) provide flexibility in interpreting market conditions, helping traders manage risk and potentially improve trade precision.
When to explore it
This script is most effective in markets with clear trending or ranging behavior, where price action gaps and momentum indicators can provide meaningful insights. It works best on liquid markets with sufficient price movement to generate reliable FVG and RSI signals.
Traders should use this tool in conjunction with other technical and fundamental analysis methods, as no single indicator can guarantee trading success. It is particularly useful for traders who appreciate a systematic approach to identifying potential trade setups across different timeframes and market conditions.
Keep exploring
What we’ve verified
Access, alerts and repainting behaviour have not been independently verified for this indicator. Check the creator’s current publication and settings.
General descriptions and classifications are recovered research. Verified details above identify the specific checks we have completed. Check the creator’s current publication for later changes.


