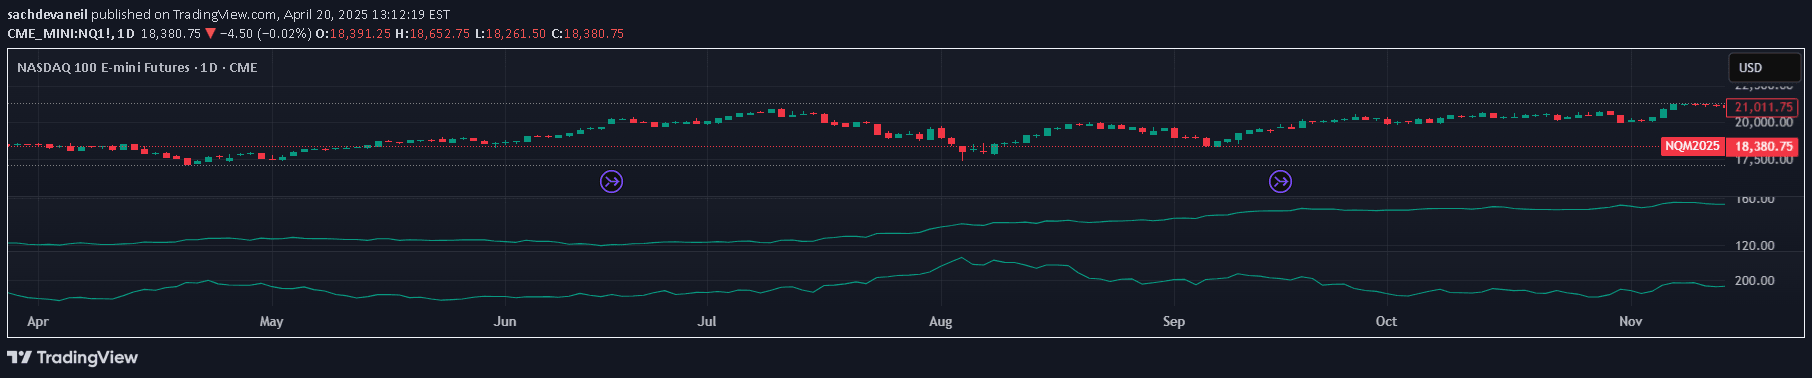
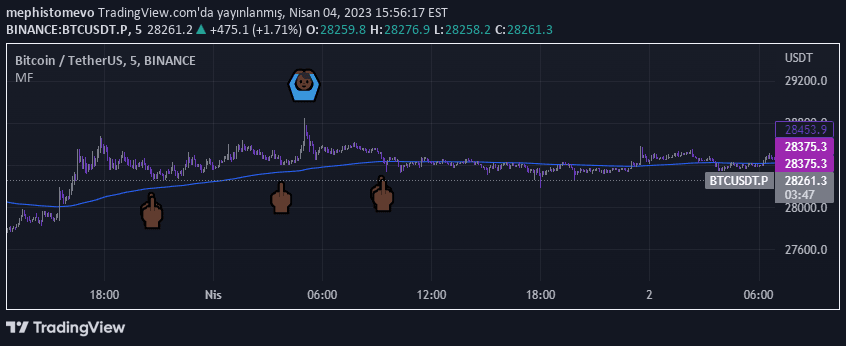
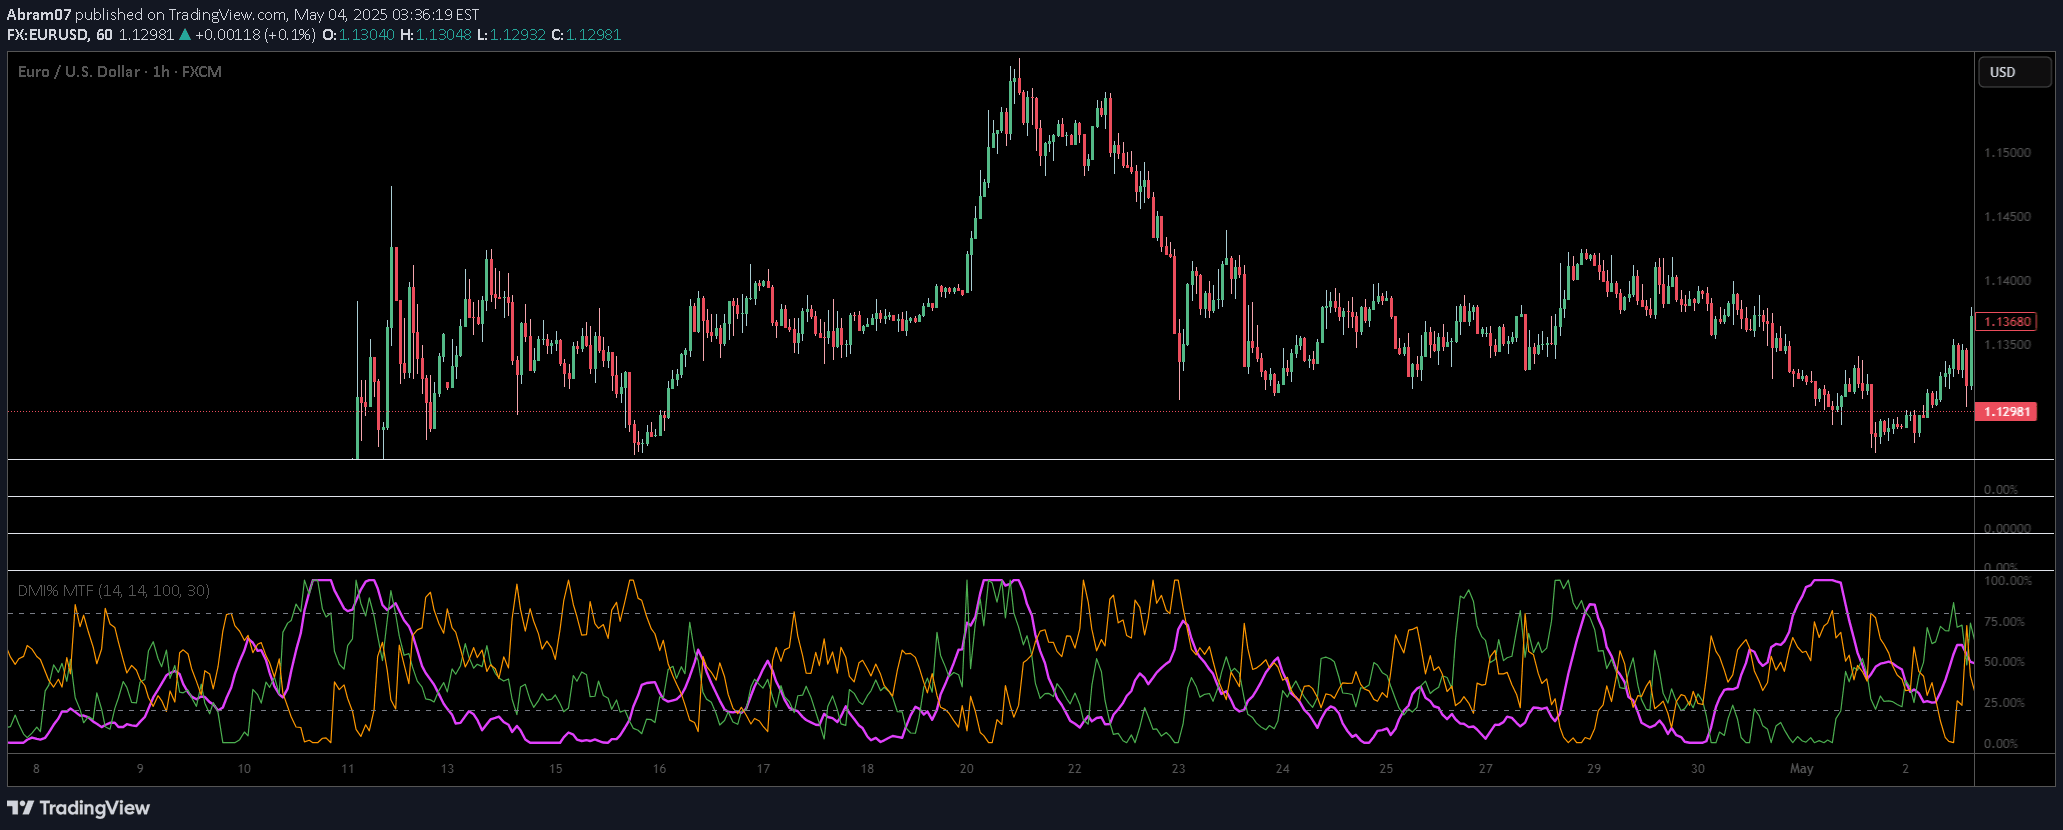
A comprehensive relative strength indicator that compares a security's performance against a benchmark, incorporating price change, volatility, and correlation to assess market dynamics.
Explore complementary indicator rolesHow it works
The Real Relative Strength (RSRW) indicator calculates rolling price changes for a selected security and a benchmark security, typically SPY, over a specified period. It computes the Average True Range (ATR) for both securities to measure market volatility and determine a power index by dividing the rolling move of the comparison security by its rolling ATR.
The indicator then calculates the Real Relative Strength by adjusting the relative price move using the power index and dividing it by the security's rolling ATR. Additionally, it evaluates the correlation between the two securities, providing a comprehensive view of the security's performance relative to the benchmark.
Why it may be useful
This indicator is crucial for traders seeking a nuanced understanding of a security's performance beyond simple price movements. By incorporating volatility and correlation, it provides a more sophisticated analysis of market dynamics, helping traders identify relative strength and potential investment opportunities.
The RSRW offers insights into how a security performs compared to a benchmark, accounting for market volatility and the interrelationship between different securities. This approach enables more informed decision-making by providing a comprehensive view of market performance and potential trading signals.
When to explore it
The Real Relative Strength indicator is most effective during periods of market uncertainty or when comparing different securities within the same sector or across different market segments. It is particularly useful for traders looking to understand the relative performance of a security beyond its absolute price movement.
Traders can utilize this indicator during market transitions, sector rotations, or when assessing the potential of a particular security relative to a broader market benchmark. It is especially valuable for day traders and swing traders seeking a more comprehensive approach to market analysis and relative performance evaluation.
Keep exploring
What we’ve verified
Access, alerts and repainting behaviour have not been independently verified for this indicator. Check the creator’s current publication and settings.
General descriptions and classifications are recovered research. Verified details above identify the specific checks we have completed. Check the creator’s current publication for later changes.