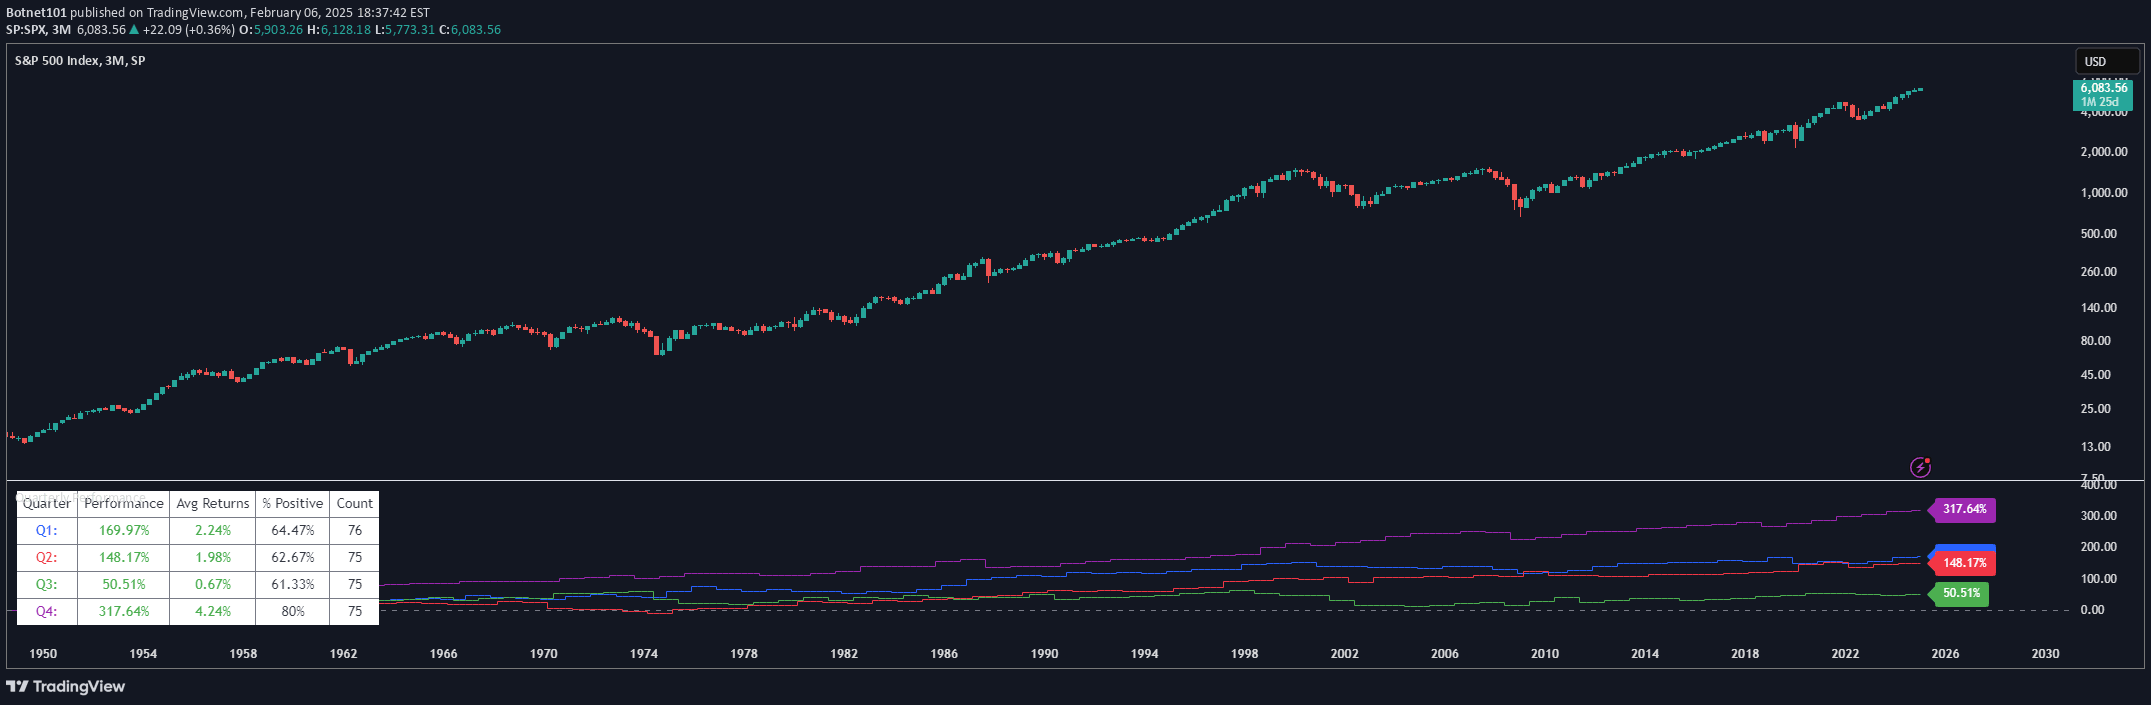
A specialized performance tracker revealing seasonal trading patterns by comparing current and historical performance across different time periods for stocks, ETFs, indices, and crypto.
Explore complementary indicator rolesHow it works
The Seasonal Performance indicator analyzes historical price data for a specific security during the same time of year across multiple past periods. It compiles statistical information including average performance, best performance, worst performance, last performance, and current performance into a comprehensive visual display.
By aggregating these metrics, traders can quickly understand the seasonal tendencies of a particular asset. The indicator creates a comparative framework that allows users to see how the current period's performance relates to historical patterns, providing insights into potential seasonal trends and cyclical behaviors.
Why it may be useful
Seasonal Performance indicators help traders identify recurring market patterns that might be influenced by cyclical factors such as economic events, industry-specific cycles, or annual business trends. By understanding these historical performance characteristics, traders can make more informed decisions about potential entry and exit points.
The indicator provides a data-driven approach to understanding market seasonality, reducing emotional decision-making and offering a structured method for analyzing potential trading opportunities. It helps traders anticipate potential market movements based on statistical evidence rather than pure speculation.
When to explore it
This indicator is most effective when analyzing stocks, ETFs, indices, and cryptocurrencies with established historical data and potentially predictable seasonal patterns. Traders should use it as a supplementary tool alongside other technical and fundamental analysis methods to validate potential trading strategies.
It is particularly useful for swing traders who are interested in multi-day or multi-week trading opportunities that align with seasonal trends. Investors can leverage this tool to understand long-term performance patterns and potentially adjust their investment strategies accordingly.
Keep exploring
What we’ve verified
Access, alerts and repainting behaviour have not been independently verified for this indicator. Check the creator’s current publication and settings.
General descriptions and classifications are recovered research. Verified details above identify the specific checks we have completed. Check the creator’s current publication for later changes.