YOUR INDICATOR RESEARCH STARTS HERE

Find the right indicator.
Understand what it does.

Explore 11,183 indicators. Filter beyond the obvious.
Discover the tools that fit the way you trade.

THE INDICATOR LIBRARY

Results for “historical”

11,183 tools to explore

1,646 indicators matching your filters
Save search
TrendMomentumEditor’s pick

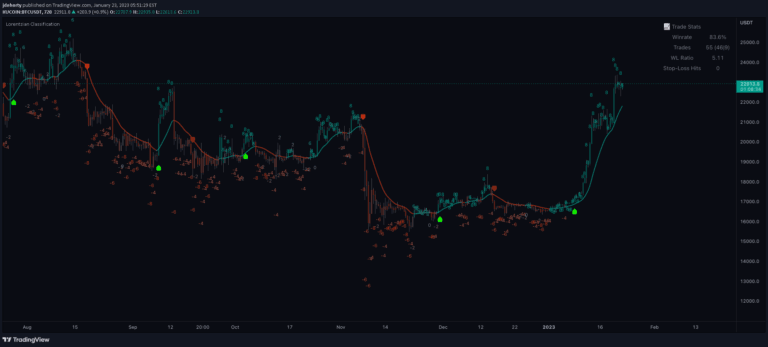
Machine Learning: Lorentzian Classification

by jdehorty

A machine learning trading signal using Lorentzian Distance Classifier to predict price movements by analyzing historical data patterns and identifying nearest neighbors in a multi-dimensional feature space.

Main price chartDay Trading · Swing Trading
Explore
24Klikes857.3Kviews784comments
Save
TrendMomentumEditor’s pick

Divergence for Many Indicators v4

by LonesomeTheBlue

Advanced trading tool that detects divergences across multiple technical indicators, helping traders identify potential trend reversals and momentum shifts through comprehensive pivot point analysis.

Main price chartDay Trading · Swing Trading
Explore
23.6Klikes661Kviews695comments
Save
VolumeSignalLevels

Liquidity Swings [LuxAlgo]

by LuxAlgo

A liquidity indicator that highlights swing areas with trading activity, tracking price revisits, accumulated volume, and potential support/resistance zones using customizable filtering.

Main price chart · unverifiedDay Trading · Swing Trading
Explore
17.9Klikes731.9Kviews131comments
Save
TrendMomentumEditor’s pick

Breakout Probability (Expo)

by Zeiierman

Breakout Probability indicator calculates the likelihood of new market highs or lows by analyzing historical price action and displaying percentage probabilities for potential price levels.

Main price chart · unverifiedDay Trading · Swing Trading
Explore
17.3Klikes648.4Kviews286comments
Save
LevelsSignal

Order Blocks & Breaker Blocks [LuxAlgo]

by LuxAlgo

Order Blocks & Breaker Blocks indicator identifies key price zones where significant trading activity occurred, highlighting potential future trading opportunities based on market structure.

Main price chart · unverifiedScalping · Day Trading
Explore
16.5Klikes539.3Kviews109comments
Save
TrendEditor’s pick

Auto Chart Patterns [Trendoscope®]

by Trendoscope

An advanced algorithmic indicator that automatically identifies and classifies complex chart patterns by analyzing trend lines, pivot points, and geometric formations across multiple timeframes.

Main price chart · unverifiedSwing Trading
Explore
12.9Klikes341.3Kviews128comments
Save
TrendMomentum

FluidTrades - SMC Lite

by Pmgjiv

A trading indicator that uses pivot points to identify supply and demand zones, market structure, and potential trading opportunities through visual analysis of price action.

Main price chart · unverifiedSwing Trading
Explore
9.4Klikes317.3Kviews171comments
Save
VolumeLevels

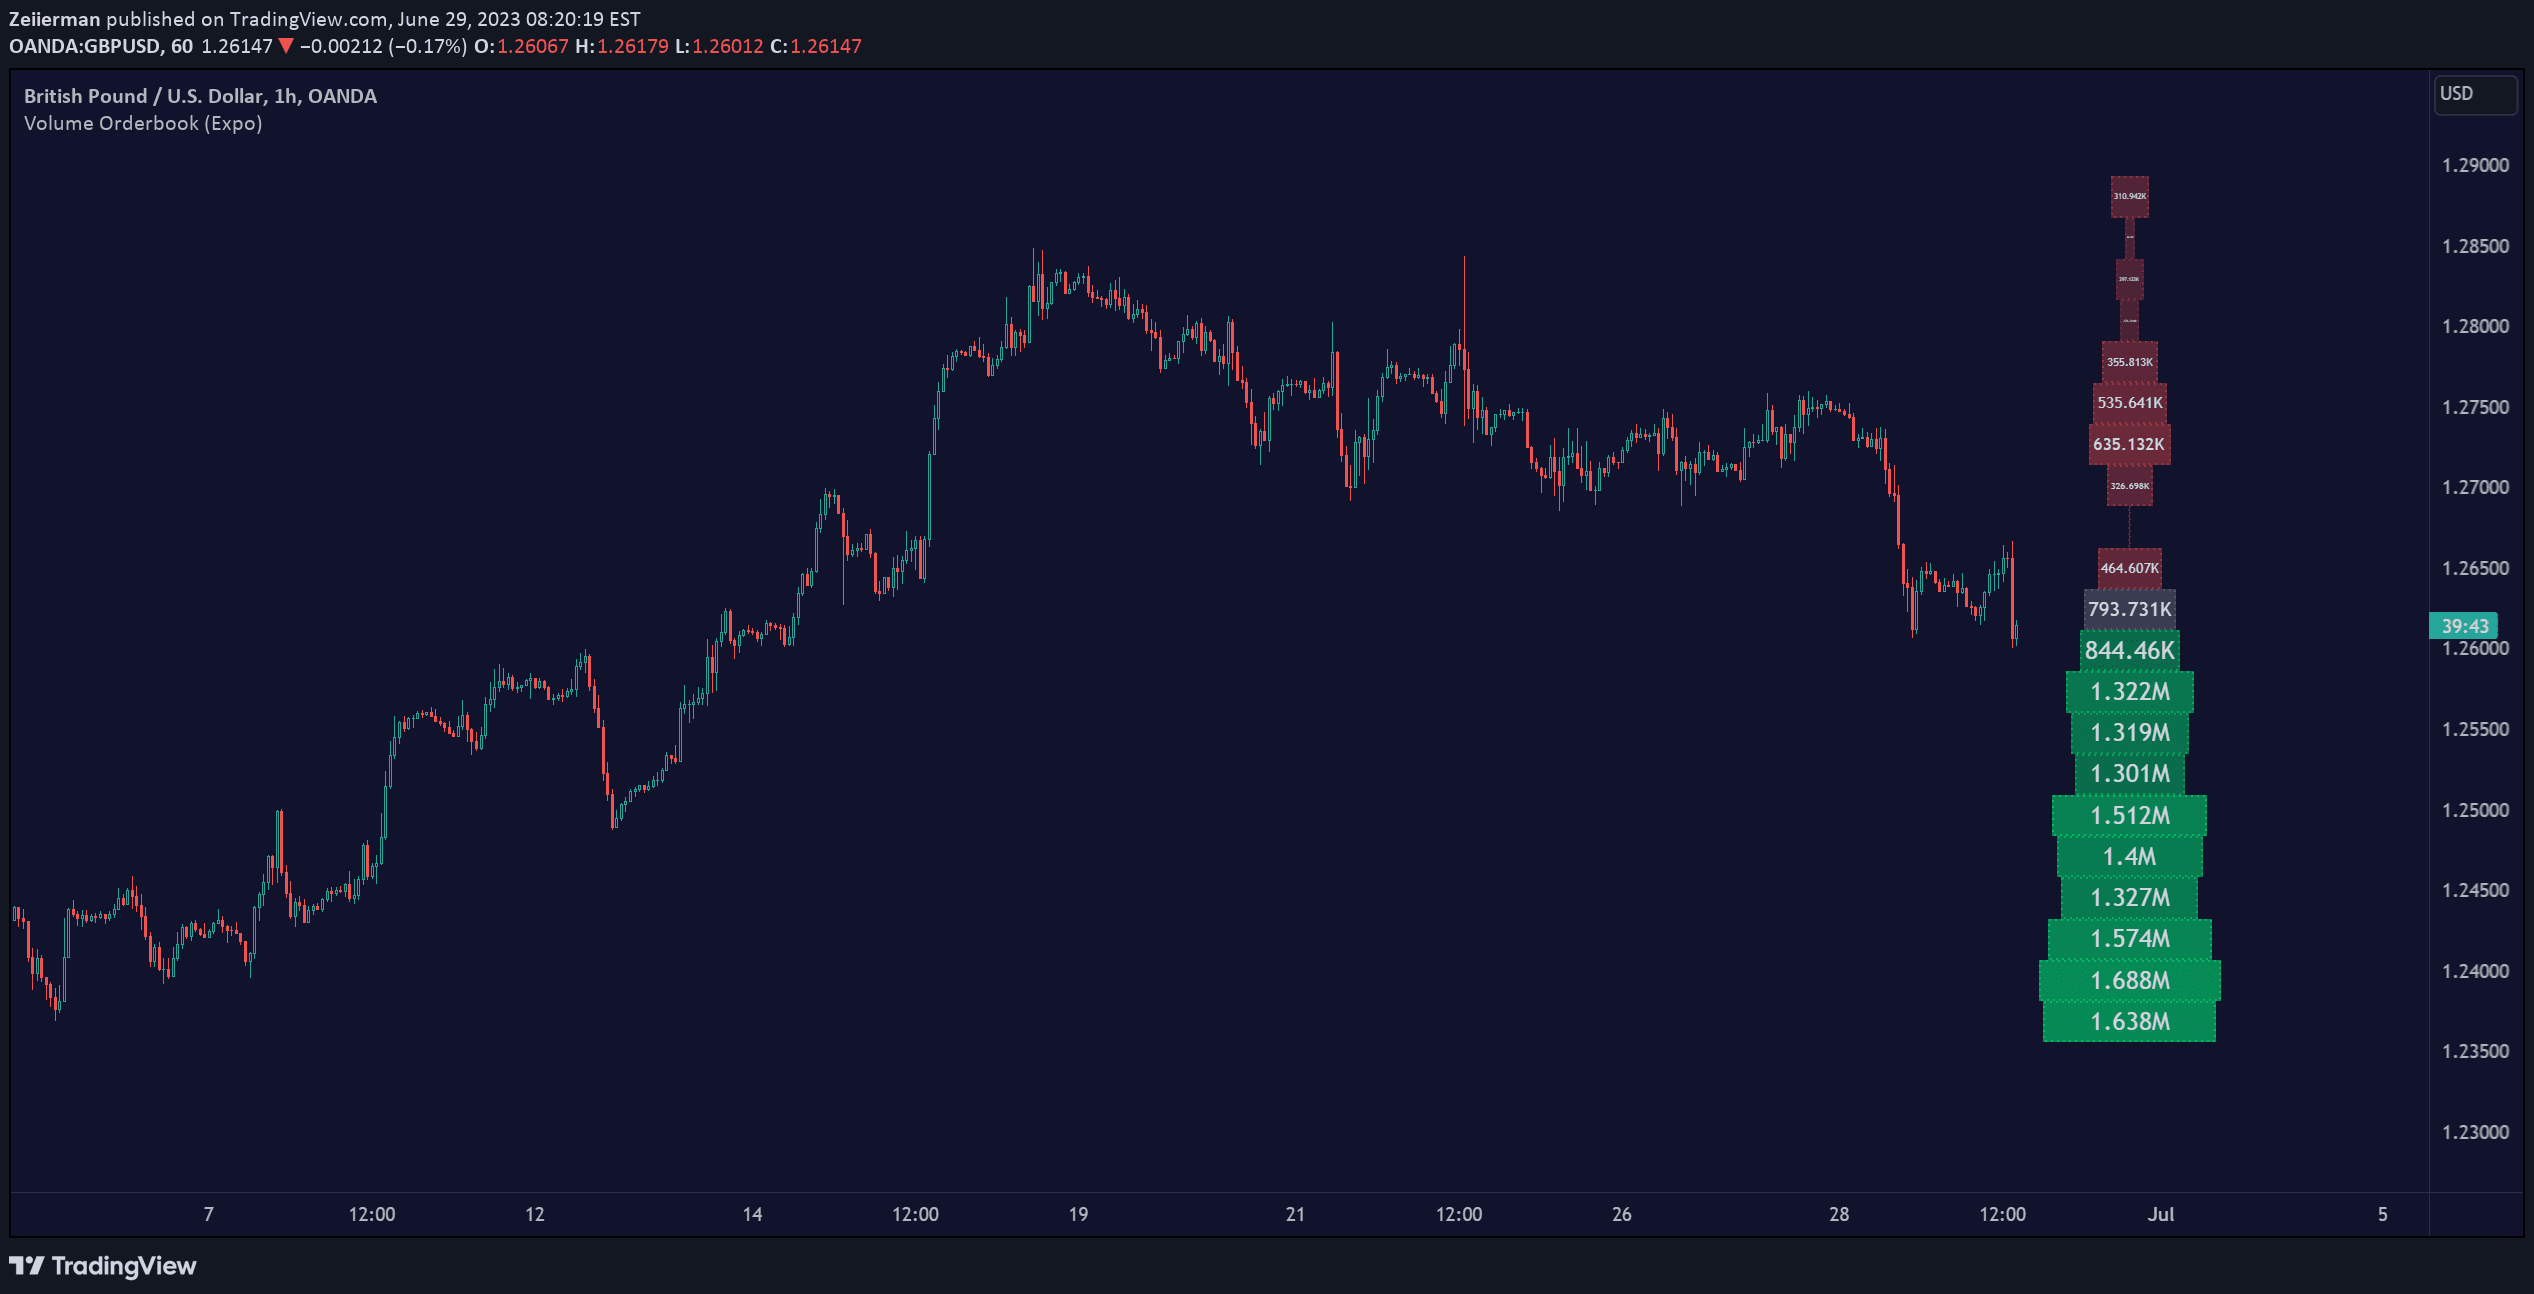
Volume Orderbook (Expo)

by Zeiierman

Volume Orderbook is a visual trading tool that displays trading volume across different price levels, helping traders identify significant market activity zones and potential support/resistance areas.

Separate pane · unverifiedScalping · Day Trading
Explore
8.4Klikes192.3Kviews127comments
Save
VolumeTrend

Global Liquidity Index

by QuantitativeAlpha

Global Liquidity Index tracks worldwide central bank balance sheets, providing a comprehensive view of global monetary conditions and potential market trends through consolidated financial data.

Separate pane · unverifiedSwing Trading
Explore
7.5Klikes212.7Kviews110comments
Save
TrendSignalChannels

Linear Regression Channel

by ChartPrime

A comprehensive technical analysis tool that uses linear regression to plot channels, bands, and future price projections, helping traders identify trends, potential reversals, and market dynamics.

Main price chart · unverifiedScalping · Day Trading
Explore
7.2Klikes92.2Kviews29comments
Save
VolumeEditor’s pick

Heatmap Volume [xdecow]

by xdecow

A volume heat map indicator that colors volume bars and candles based on the standard deviation of trading volume from its average. Provides visual insights into volume intensity and potential market significance.

Separate pane · unverifiedDay Trading · Swing Trading
Explore
7.2Klikes214.2Kviews107comments
Save

Likes, views, and comments are historical TradingView snapshots. They describe attention, not trading performance.

START WITH A QUESTION

A little less searching.
A lot more understanding.

Tell DeepAlpha what you need. Get an explanation, a shortlist,
and a direct path to the indicators behind it.

Ask DeepAlpha