A powerful seasonal trading indicator that reveals market patterns by analyzing historical price movements across different market cycles, including presidential election impacts.
Explore complementary indicator rolesHow it works
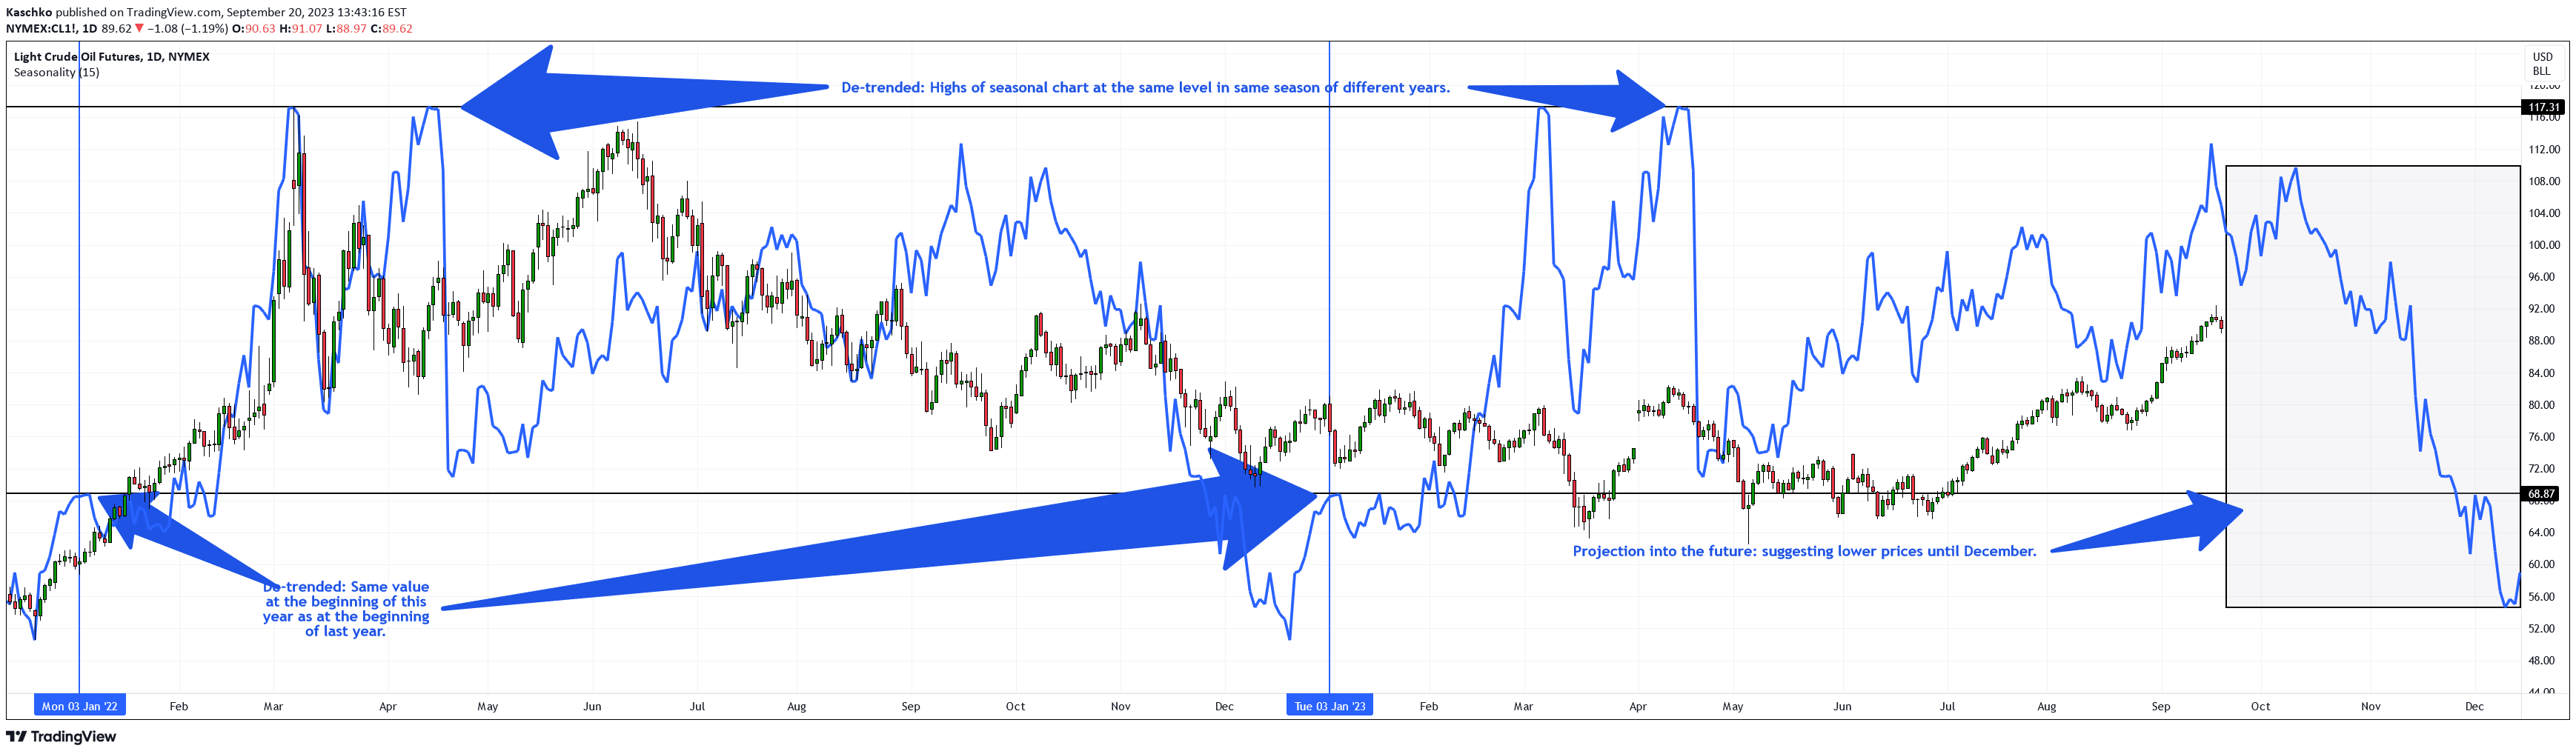
The seasonal trading indicator leverages historical market data to identify recurring price patterns across different timeframes and market conditions. It uses a sophisticated algorithm that analyzes past market movements, extracting seasonal trends and presidential cycle influences.
By comparing current market data with historical patterns, the indicator generates two key visualization lines: a blue line representing pure seasonality and a green line incorporating presidential cycle dynamics. The system relies on request.seed() function to retrieve data from a dedicated GitHub repository, enabling precise and up-to-date seasonal analysis.
Why it may be useful
Seasonal trading patterns provide traders with a strategic advantage by revealing predictable market behaviors that repeat over time. Understanding these cyclical trends can help investors anticipate potential market movements and make more informed trading decisions.
The inclusion of presidential cycle analysis adds an extra layer of complexity and insight, allowing traders to understand how political events and transitions might impact market performance. By identifying these underlying patterns, traders can develop more robust and nuanced trading strategies that account for longer-term market rhythms.
When to explore it
This indicator is most effective for traders looking to understand long-term market trends and seasonal variations across different indices, stocks, and industries. It is particularly valuable for swing traders and investors who take a more strategic, macro-level approach to market analysis.
Traders should use this indicator when seeking to develop comprehensive trading strategies that go beyond short-term price movements. It is especially useful during periods of potential market transition, such as the beginning of new quarters, seasonal shifts, or around significant political events that might influence market sentiment.
Keep exploring
What we’ve verified
Access, alerts and repainting behaviour have not been independently verified for this indicator. Check the creator’s current publication and settings.
General descriptions and classifications are recovered research. Verified details above identify the specific checks we have completed. Check the creator’s current publication for later changes.