
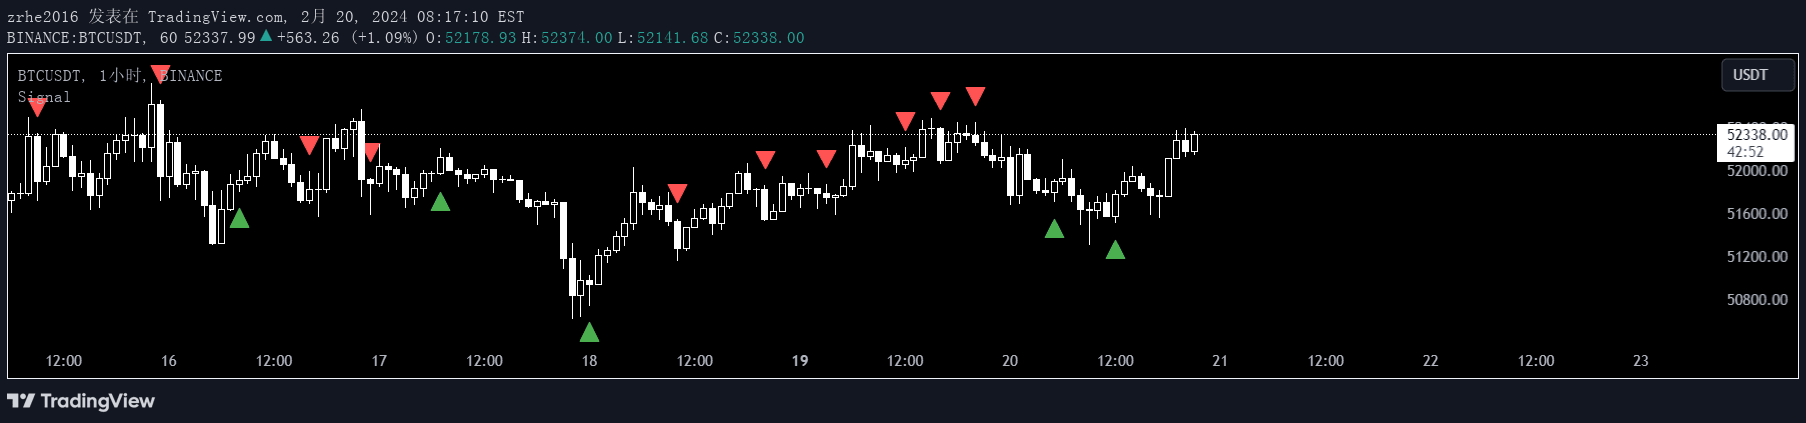
A custom TradingView indicator that generates buy and sell signals using the Stochastic Oscillator, dynamically adjusting settings based on chart timeframe to identify potential trading opportunities.
Explore complementary indicator rolesHow it works
The Signal indicator utilizes the Stochastic Oscillator to generate trading signals by calculating the %K and %D lines. It dynamically adjusts its length based on the chart's timeframe, with shorter periods for smaller time frames and longer periods for larger time frames. The indicator smooths these lines using Simple Moving Averages (SMA) to reduce noise and provide more reliable signals.
The core mechanism involves identifying crossovers between the %K and %D lines, with specific confirmation conditions. A bullish signal occurs when the %K line crosses above the %D line and the average is below 50, while a bearish signal happens when the %K line crosses below the %D line and the average is above 50. These signals are confirmed using a one-bar offset to prevent repainting issues.
Why it may be useful
The Signal indicator provides traders with a systematic approach to identifying potential entry and exit points in the market. By leveraging the Stochastic Oscillator's momentum analysis, it helps traders recognize overbought and oversold conditions, which can indicate potential trend reversals or continuation. The dynamic period adjustment ensures that the indicator remains responsive across different timeframes, making it adaptable to various trading styles and market conditions.
Moreover, the visual representation of signals through colored triangles makes it easy for traders to quickly identify potential trading opportunities. The built-in alert conditions further enhance its utility by notifying traders of significant momentum shifts, allowing for more timely and informed trading decisions.
When to explore it
The Signal indicator is most effective in markets with clear momentum trends and moderate volatility. It performs best in timeframes ranging from 15-minute to 1-hour charts, where the stochastic oscillator can effectively capture short to medium-term price movements. Traders should primarily use this indicator in trending markets where momentum signals are more reliable and meaningful.
Ideal usage includes combining the Signal indicator with other technical analysis tools to confirm signals and manage risk. It is particularly useful for traders looking to capture short-term price movements, identify potential trend reversals, and make more informed trading decisions based on momentum indicators. However, traders should always use additional confirmation methods and risk management strategies when implementing these signals.
Keep exploring
What we’ve verified
Access, alerts and repainting behaviour have not been independently verified for this indicator. Check the creator’s current publication and settings.
General descriptions and classifications are recovered research. Verified details above identify the specific checks we have completed. Check the creator’s current publication for later changes.


