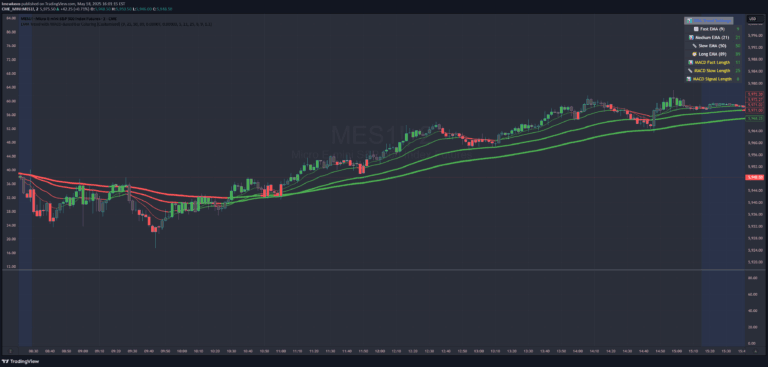
A trading indicator designed for experienced traders to identify and color-code specific bar types like inside, outside, and 2-up/2-down bars with customizable visual references.
Explore complementary indicator rolesHow it works
The indicator analyzes price bars and classifies them into specific categories like inside bars, outside bars, 2-up, and 2-down bars. It then color-codes these bars to provide visual clarity about their characteristics and potential trading significance.
Additionally, the tool automatically extends reference lines from the previous two bars' highs and lows, helping traders quickly understand potential support and resistance levels. Users can customize the color coding and line extensions, allowing for personalized visual tracking of price action scenarios.
Why it may be useful
This indicator simplifies complex price action analysis by providing immediate visual cues about bar types and potential trading scenarios. By color-coding and extending reference lines, traders can quickly identify potential trend reversals, breakout opportunities, and structural shifts in the market.
The customizable settings enable traders to adapt the tool to their specific trading style and preferences, making it a flexible and user-friendly approach to understanding price action dynamics without cluttering the chart with excessive markings.
When to explore it
The indicator is most effective for experienced traders who understand 1-2-3 trading scenarios and want a clean, straightforward method of tracking price action. It works best in markets with clear directional movements and when traders are looking for precise entry and exit points based on bar configurations.
Particularly useful for traders focusing on inside bar breakouts and those who want to quickly assess potential trend reversals or continuation patterns. The tool is especially valuable in volatile markets where quick visual recognition of price action can provide a strategic trading advantage.
Keep exploring
What we’ve verified
Access, alerts and repainting behaviour have not been independently verified for this indicator. Check the creator’s current publication and settings.
General descriptions and classifications are recovered research. Verified details above identify the specific checks we have completed. Check the creator’s current publication for later changes.