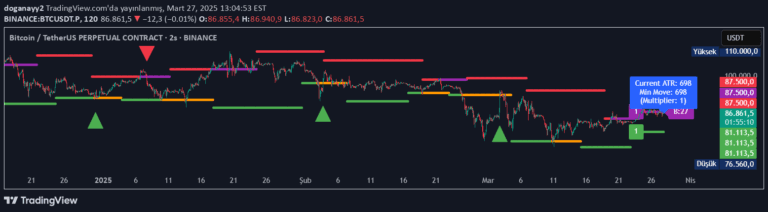
A technical analysis tool that projects potential future price ranges by calculating rolling standard deviation from log returns, helping traders visualize expected price dispersion.
Explore complementary indicator rolesHow it works
The Simple Volatility Cone indicator begins by calculating log returns over a specified time window, which transforms price changes into a more statistically manageable format. It then computes the rolling standard deviation of these log returns, which quantifies the price movement's variability and dispersion over time. By applying statistical principles, the indicator creates a geometric projection of potential future price ranges using confidence intervals.
These confidence intervals are plotted as upper and lower bounds, creating a visual 'cone' that extends into future price periods. The width of the cone represents the potential price dispersion, with wider cones indicating higher expected volatility and narrower cones suggesting more stable price movement. Traders can interpret these bounds as potential areas of price exploration under a geometric Brownian motion assumption.
Why it may be useful
The Volatility Cone provides traders with a probabilistic view of potential price movement, transforming abstract volatility measurements into a tangible visual representation. By quantifying potential price ranges, traders can make more informed decisions about risk management, position sizing, and potential trade entry and exit points. The indicator helps traders understand the inherent uncertainty in price movement and prepare for potential market fluctuations.
Beyond individual trade planning, the Volatility Cone offers insights into market psychology and expected price behavior. It allows traders to anticipate potential price expansion or contraction, helping them adjust their strategies accordingly. The tool bridges the gap between historical price data and future price expectations, providing a statistical framework for understanding market dynamics.
When to explore it
The Simple Volatility Cone is most effective in markets with relatively consistent volatility patterns, such as liquid stocks, major currency pairs, and actively traded commodities. It works best when applied to timeframes that capture meaningful market cycles, typically ranging from daily to weekly charts. Traders should use this indicator in conjunction with other technical and fundamental analysis tools to validate its insights and make more comprehensive trading decisions.
The indicator is particularly useful during periods of market transition or uncertainty, where understanding potential price ranges can provide a strategic advantage. It is especially valuable for options traders, risk managers, and traders developing mean-reversion or trend-following strategies. Traders should be cautious during extreme market events or sudden volatility shifts, as the indicator's projections may become less reliable.
Keep exploring
What we’ve verified
Access, alerts and repainting behaviour have not been independently verified for this indicator. Check the creator’s current publication and settings.
General descriptions and classifications are recovered research. Verified details above identify the specific checks we have completed. Check the creator’s current publication for later changes.