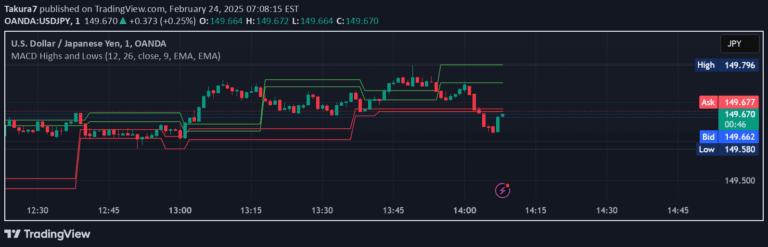
A logarithmic risk metric that assesses an asset's price position within a specified range, providing normalized insights into relative price movements and potential entry/exit points.
Explore complementary indicator rolesHow it works
The Relative Risk Metric utilizes a logarithmic transformation to calculate a normalized value between 0 and 1, representing an asset's current price relative to predefined lower and upper bounds. It computes this by applying a natural logarithm function that transforms the current price, effectively mapping its position on a logarithmic scale.
The metric generates multiple series including the raw risk metric, a smoothed version, and entry/exit points. Dynamic parameters like decay, time offset, and sensitivity allow fine-tuning of the calculation, enabling traders to adjust the indicator's responsiveness to price movements and capture nuanced market conditions.
Why it may be useful
This risk metric provides traders with a sophisticated method of understanding price positioning beyond traditional linear measurements, offering insights into relative price movements that account for exponential market behaviors. By transforming price data into a normalized logarithmic scale, it helps traders identify potential overbought or oversold conditions more accurately than conventional indicators.
The weighted entry/exit mechanism further enhances its utility by providing a nuanced approach to determining trade opportunities. Its ability to dynamically adjust thresholds and emphasize key price levels makes it a powerful tool for risk management and strategic decision-making across different market environments.
When to explore it
The Relative Risk Metric is most effective in markets with significant price variations and potential exponential growth patterns, such as cryptocurrency, technology stocks, or emerging market assets. It performs exceptionally well when traders need a comprehensive view of price movements that goes beyond simple linear interpretations.
Traders should leverage this indicator during periods of market transition, when traditional linear indicators might miss subtle shifts in momentum or risk. It is particularly valuable in volatile markets where understanding relative price positioning can provide a critical edge in identifying potential entry and exit points with greater precision.
Keep exploring
What we’ve verified
Access, alerts and repainting behaviour have not been independently verified for this indicator. Check the creator’s current publication and settings.
General descriptions and classifications are recovered research. Verified details above identify the specific checks we have completed. Check the creator’s current publication for later changes.