
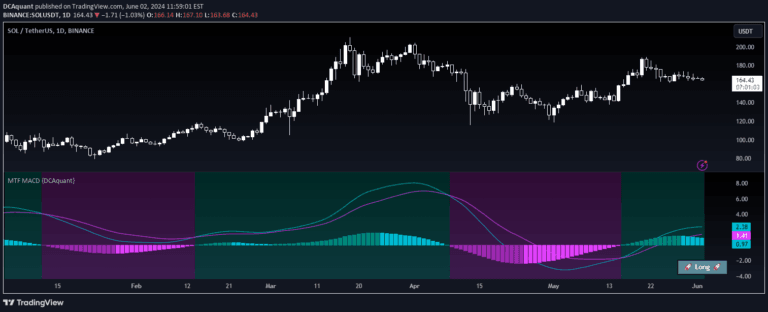
Multi Timeframe Moving Average Convergence Divergence {DCAquant}
A multi-timeframe MACD indicator that analyzes market trends across different time horizons, providing comprehensive insights into price momentum and potential trading opportunities.
Explore 11,183 indicators. Filter beyond the obvious.
Discover the tools that fit the way you trade.
11,183 tools to explore
A multi-timeframe MACD indicator that analyzes market trends across different time horizons, providing comprehensive insights into price momentum and potential trading opportunities.
A custom trading indicator that allows users to modify candle colors within a specific intraday trading session, providing enhanced visual customization and highlighting key market periods.
A comprehensive trading tool that calculates liquidation prices, helps manage Dollar Cost Averaging (DCA) strategies, and provides risk management insights for traders.
Dollar-Cost Averaging (DCA) indicator that compares investing a fixed amount periodically versus a lump sum investment, helping traders analyze long-term investment strategies across different timeframes.
Multi Timeframe RSI analyzes market momentum across different timeframes, helping traders identify trend strength, potential reversals, and market sentiment using customizable RSI calculations.
The Neutral State MACD is an advanced momentum indicator that identifies market equilibrium phases by analyzing MACD line relationships and highlighting potential trend transition points.
An advanced Stochastic Oscillator variant that identifies neutral market states by analyzing the convergence of %K and %D lines, offering refined momentum insights.
A dynamic risk analysis tool that uses price action and moving averages to provide normalized risk levels from 0-1, helping traders identify optimal entry and exit points.
Alert on Candle Close is a TradingView indicator that allows traders to set custom alerts when a specific timeframe's candlestick closes, helping track key market moments.
A Dollar Cost Averaging (DCA) indicator that uses color-coded candles and dynamic support/resistance levels to help investors strategically manage long-term investment entries and exits.
A custom trading indicator combining KDJ and RSI to identify market momentum shifts through color-coded candles, providing visual signals for potential trend changes and entry/exit points.
A statistical regression analysis for Bitcoin trading that uses three price boundary lines to identify optimal buying and selling opportunities based on historical price data.
Likes, views, and comments are historical TradingView snapshots. They describe attention, not trading performance.
