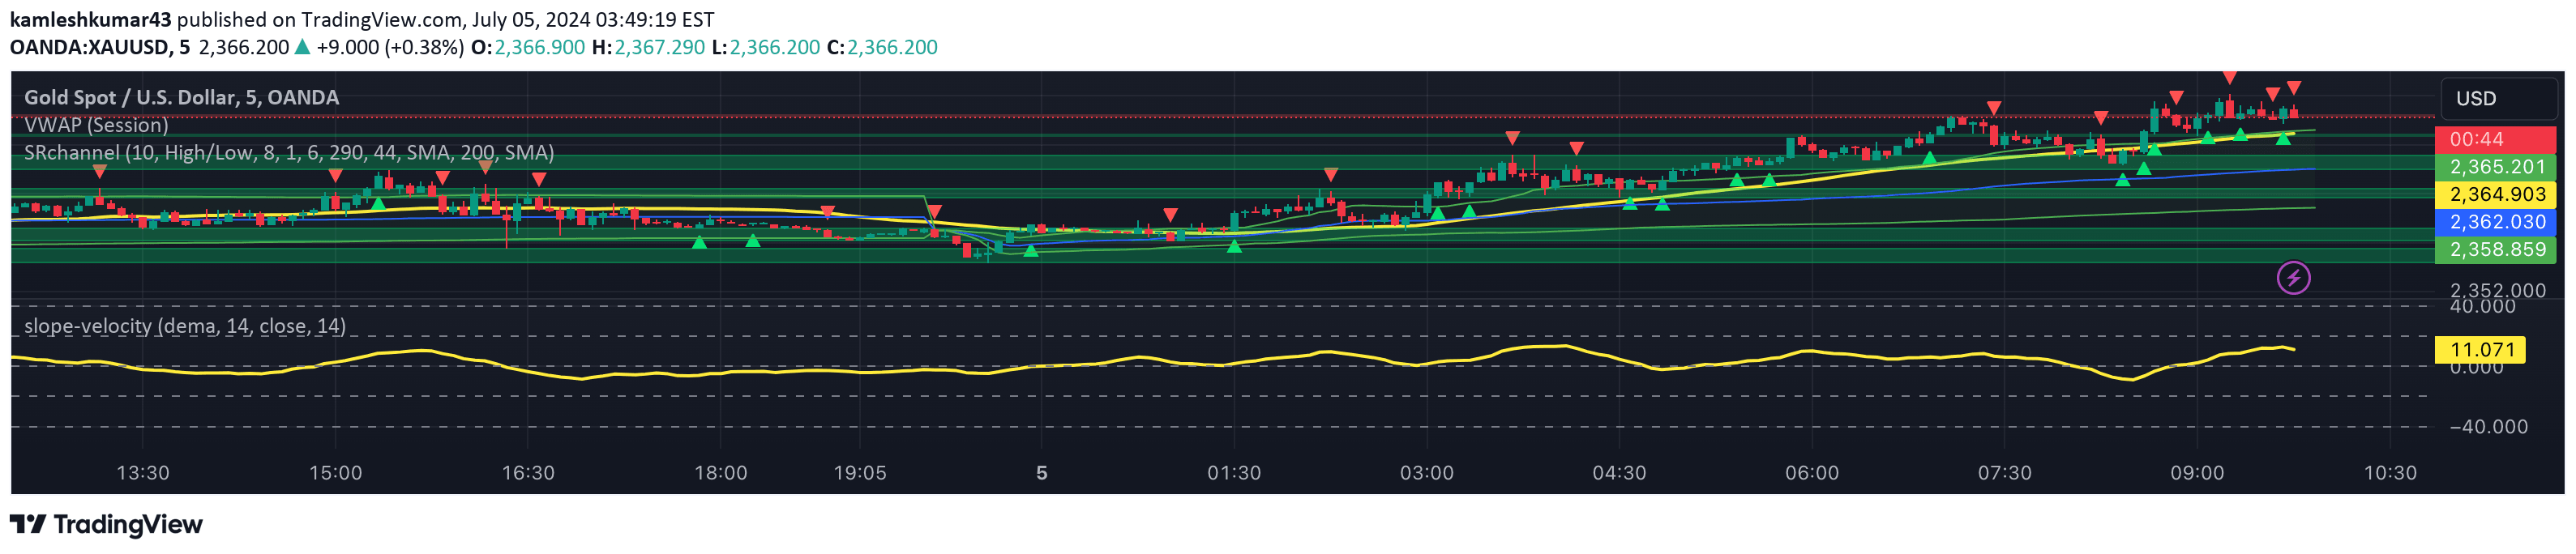
A slope-velocity indicator that calculates moving average slope in degrees, providing insights into the rate of change and potential trend dynamics in price movement.
Explore complementary indicator rolesHow it works
The slope-velocity indicator operates by calculating the moving average of price using three potential methods: Simple Moving Average (SMA), Exponential Moving Average (EMA), or Double Exponential Moving Average (DEMA). It then computes the slope by comparing the current period's moving average value with the previous period's value.
The unique aspect of this indicator is its conversion of the slope into degrees using arctangent calculation. This transformation allows traders to visualize the moving average's rate of change more intuitively, with positive and negative degree values representing upward and downward movements respectively.
Why it may be useful
The slope-velocity indicator provides traders with a dynamic visualization of price momentum and trend strength by representing moving average changes in degrees. This approach allows for quick identification of trend acceleration, deceleration, and potential reversal points, which can be crucial for making timely trading decisions.
By offering a clear representation of price movement's rate of change, the indicator helps traders understand market dynamics beyond traditional price charts. The color-coded histogram makes it easy to distinguish between positive and negative slope trends, enabling faster pattern recognition and more informed trading strategies.
When to explore it
The slope-velocity indicator is most effective in markets with clear trending characteristics, such as forex, futures, and actively traded stocks. It works best in timeframes ranging from short-term (minutes) to medium-term (hours), making it particularly useful for scalping and day trading strategies.
Traders should use this indicator in conjunction with other technical analysis tools to confirm signals and reduce false positives. It is especially valuable during periods of market volatility, where rapid changes in trend direction can present significant trading opportunities.
Keep exploring
What we’ve verified
Access, alerts and repainting behaviour have not been independently verified for this indicator. Check the creator’s current publication and settings.
General descriptions and classifications are recovered research. Verified details above identify the specific checks we have completed. Check the creator’s current publication for later changes.