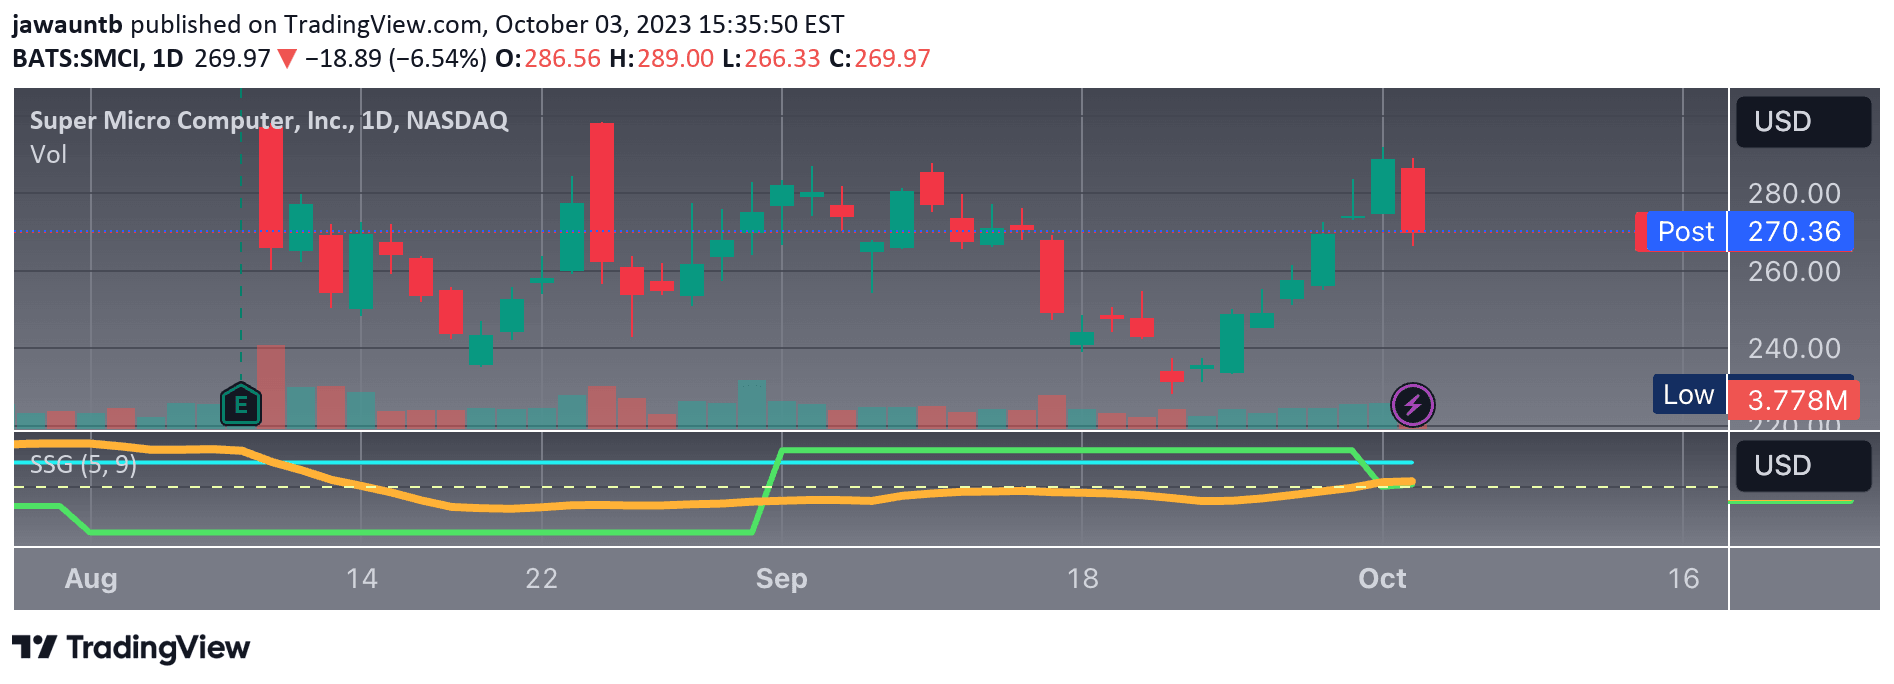
The Stocks Seasonality Gauge (SSG) Indicator analyzes historical stock performance and recent price movements to provide insights into potential future market behaviors using seasonality and EMA computations.
Explore complementary indicator rolesHow it works
The Stocks Seasonality Gauge (SSG) Indicator operates by first analyzing historical monthly returns over a specified number of lookback years. It calculates the average performance of the current month and compares it with the average monthly performance for the current year to date.
The indicator then evaluates recent price movements by computing percentage price changes over 21-day and 7-day periods. An Exponential Moving Average (EMA) is constructed based on recent price changes, providing a smoothed perspective on the stock's current month performance, with the EMA length customizable to suit different trading scenarios.
Why it may be useful
The SSG Indicator is crucial for traders seeking to understand a stock's performance beyond immediate price action. By integrating historical seasonality data with recent price momentum, it offers a comprehensive view of potential market behaviors that goes beyond traditional technical analysis methods.
This sophisticated approach allows traders to anticipate potential trends by leveraging historical performance patterns and short-term price movements. The indicator's ability to blend multiple analytical perspectives provides traders with a nuanced understanding of stock performance, enabling more informed and strategic trading decisions.
When to explore it
The Stocks Seasonality Gauge (SSG) Indicator is most effective when traders want to analyze stocks with established historical performance patterns. It works best for assets with consistent seasonal trends, such as stocks in specific sectors that demonstrate predictable annual performance characteristics.
Traders should utilize this indicator when seeking to understand long-term performance trends while simultaneously evaluating short-term momentum. It is particularly valuable during periods of market uncertainty, providing additional context and insights that can help traders make more confident and data-driven investment decisions.
Keep exploring
What we’ve verified
Access, alerts and repainting behaviour have not been independently verified for this indicator. Check the creator’s current publication and settings.
General descriptions and classifications are recovered research. Verified details above identify the specific checks we have completed. Check the creator’s current publication for later changes.