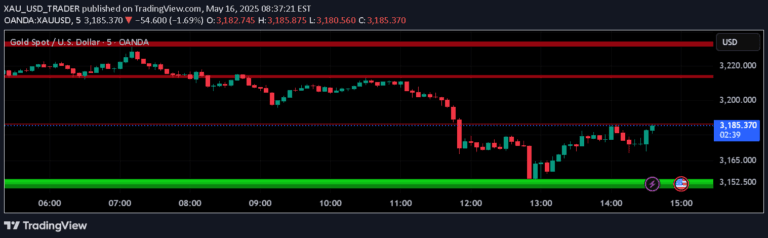
A Double Moving Average strategy that generates buy and sell signals by tracking the crossover of short-term and long-term moving averages to identify potential market trend changes.
Explore complementary indicator rolesHow it works
The Double Moving Average (DMA) strategy calculates two Simple Moving Averages (SMAs) with identical 28-bar periods: a short-term and a long-term moving average. The short-term moving average tracks current price trends, while the long-term moving average is displaced backward by 14 bars to provide a broader market perspective.
When the short-term moving average crosses above the long-term moving average, it generates a buy signal, indicating a potential upward price movement. Conversely, when the short-term moving average crosses below the long-term moving average, it triggers a sell signal, suggesting a possible downward price trend.
Why it may be useful
The DMA strategy helps traders identify potential trend reversals and market momentum by providing clear visual signals based on moving average crossovers. It offers a systematic approach to understanding market dynamics, helping traders make more informed decisions about entering or exiting positions.
By comparing short-term and long-term price trends, this method allows traders to filter out short-term market noise and focus on more significant price movements. The strategy provides a straightforward mechanism for detecting potential trend changes, making it valuable for traders seeking to understand underlying market trends.
When to explore it
The DMA strategy is most effective in markets with clear trending characteristics, where price movements show consistent directional momentum. It works best in liquid markets with moderate volatility, such as major stock indices, forex pairs, and actively traded commodities.
Traders should use this strategy in conjunction with other technical analysis tools and risk management techniques to confirm signals and validate potential trade opportunities. It is particularly useful for traders seeking to capture medium-term trend movements and wanting a systematic approach to identifying potential entry and exit points.
Keep exploring
What we’ve verified
Access, alerts and repainting behaviour have not been independently verified for this indicator. Check the creator’s current publication and settings.
General descriptions and classifications are recovered research. Verified details above identify the specific checks we have completed. Check the creator’s current publication for later changes.