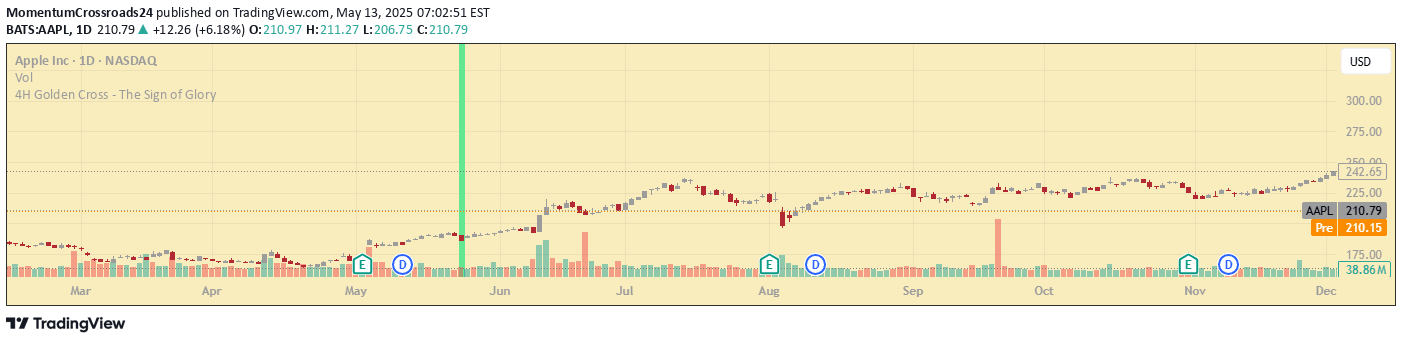
A dynamic indicator that tracks multiple Simple Moving Averages to provide real-time market trend insights and intersection alerts for precise trading decision-making.
Explore complementary indicator rolesHow it works
The Dynamic SMA Intersection Alert Indicator operates by calculating four distinct Simple Moving Averages (8, 20, 50, and 200 periods) and tracking their interactions with current price action. It systematically computes these moving averages and monitors their positions relative to each other and the price, creating a comprehensive view of market momentum.
When price crosses any of these moving averages, the indicator triggers real-time alerts and visual markers. Green triangles represent bullish crosses, while red triangles indicate bearish crosses, allowing traders to quickly identify potential trend changes and critical market entry or exit points.
Why it may be useful
The indicator simplifies complex market analysis by providing a clear, visual representation of trend dynamics through multiple moving averages. By consolidating different timeframe perspectives into a single tool, traders can quickly assess market sentiment and potential directional shifts without complex manual calculations.
Its multi-layered approach offers traders a comprehensive view of market momentum, helping them make more informed decisions. The real-time alerts and visual cues reduce cognitive load, allowing traders to respond faster to emerging market opportunities and potential trend reversals.
When to explore it
The Dynamic SMA Intersection Alert Indicator is most effective in markets with clear trending characteristics, such as forex, stocks, and major commodities. It performs optimally in markets experiencing moderate to strong directional movements, where moving average interactions can signal meaningful trend changes.
Traders should utilize this indicator during periods of established market trends, particularly when seeking to confirm entry and exit points across different trading timeframes. It is especially valuable when combined with other technical analysis tools to validate signals and reduce false positive interpretations.
Keep exploring
What we’ve verified
Access, alerts and repainting behaviour have not been independently verified for this indicator. Check the creator’s current publication and settings.
General descriptions and classifications are recovered research. Verified details above identify the specific checks we have completed. Check the creator’s current publication for later changes.