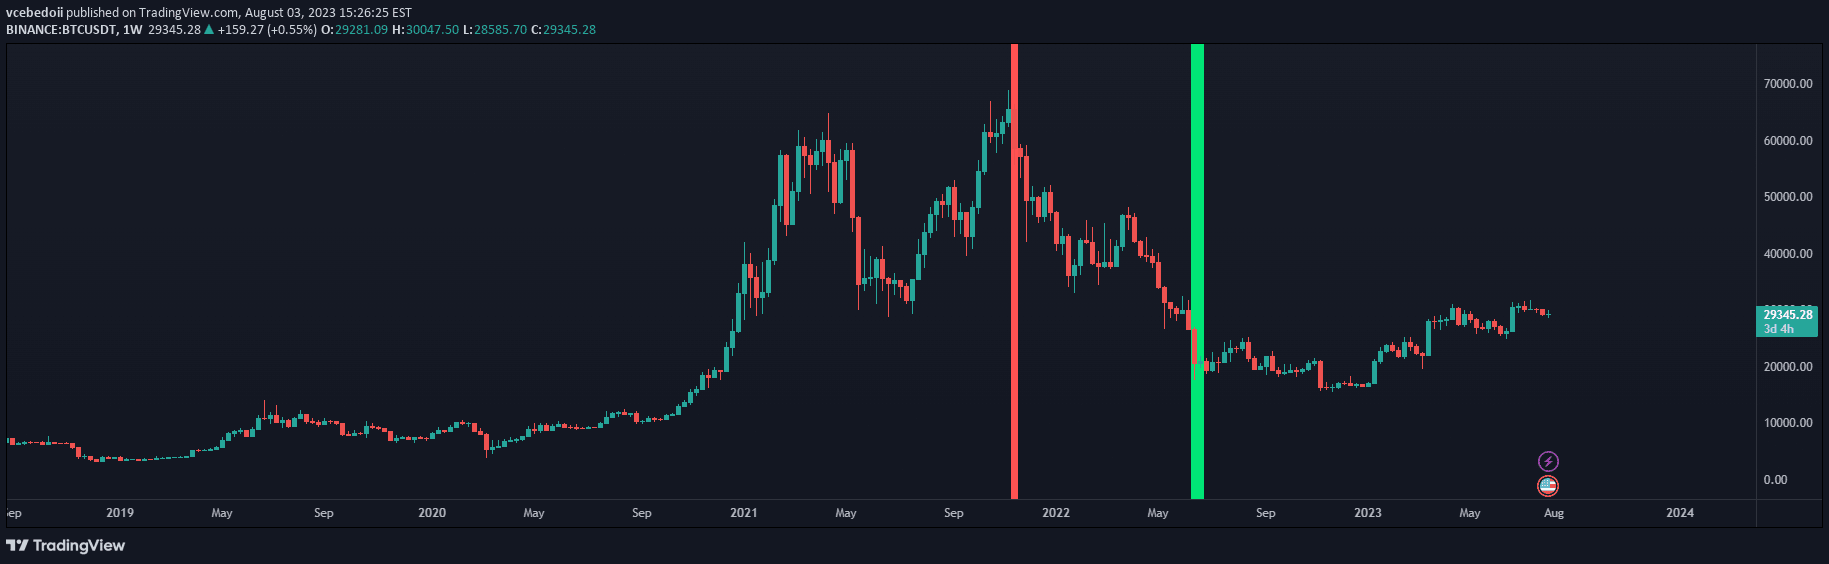
SMI-Darkness is a customizable Stochastic Momentum Index indicator that helps traders identify trend strength, potential buy/sell signals, and market momentum through smoothed calculations and histogram visualization.
Explore complementary indicator rolesHow it works
The SMI-Darkness calculates the Stochastic Momentum Index using a configurable short period and applies a smoothing technique through selectable moving average types like SMA, EMA, or VWMA. It generates a smoothed SMI line and a corresponding signal line to track momentum dynamics.
The indicator creates a histogram that visually represents the difference between the SMI and signal lines, with blue bars indicating bullish momentum and yellow bars signaling bearish momentum. By incorporating horizontal reference lines at +40, -40, and zero, traders can quickly assess overbought, oversold, and neutral market conditions.
Why it may be useful
The SMI-Darkness provides traders with a nuanced view of market momentum by offering multiple customization options and clear visual representations of trend strength. Its flexible moving average selection allows traders to adapt the indicator to different market conditions and personal trading styles, enhancing decision-making capabilities.
By presenting momentum through color-coded histograms and reference lines, the indicator simplifies complex market dynamics and helps traders identify potential entry and exit points more intuitively. This approach reduces the cognitive load of interpreting raw price data and provides a structured method for understanding market sentiment.
When to explore it
The SMI-Darkness is most effective in markets with clear trending characteristics, such as forex, stocks, and cryptocurrency markets. It performs best when traders want to assess momentum across multiple timeframes and require a flexible, customizable momentum indicator that can be fine-tuned to different trading strategies.
Traders should utilize this indicator during periods of moderate to high market volatility, where momentum shifts can provide valuable insights. It is particularly useful when combined with other technical analysis tools to confirm signals and reduce false positives, making it a valuable component of a comprehensive trading strategy.
Keep exploring
What we’ve verified
Access, alerts and repainting behaviour have not been independently verified for this indicator. Check the creator’s current publication and settings.
General descriptions and classifications are recovered research. Verified details above identify the specific checks we have completed. Check the creator’s current publication for later changes.