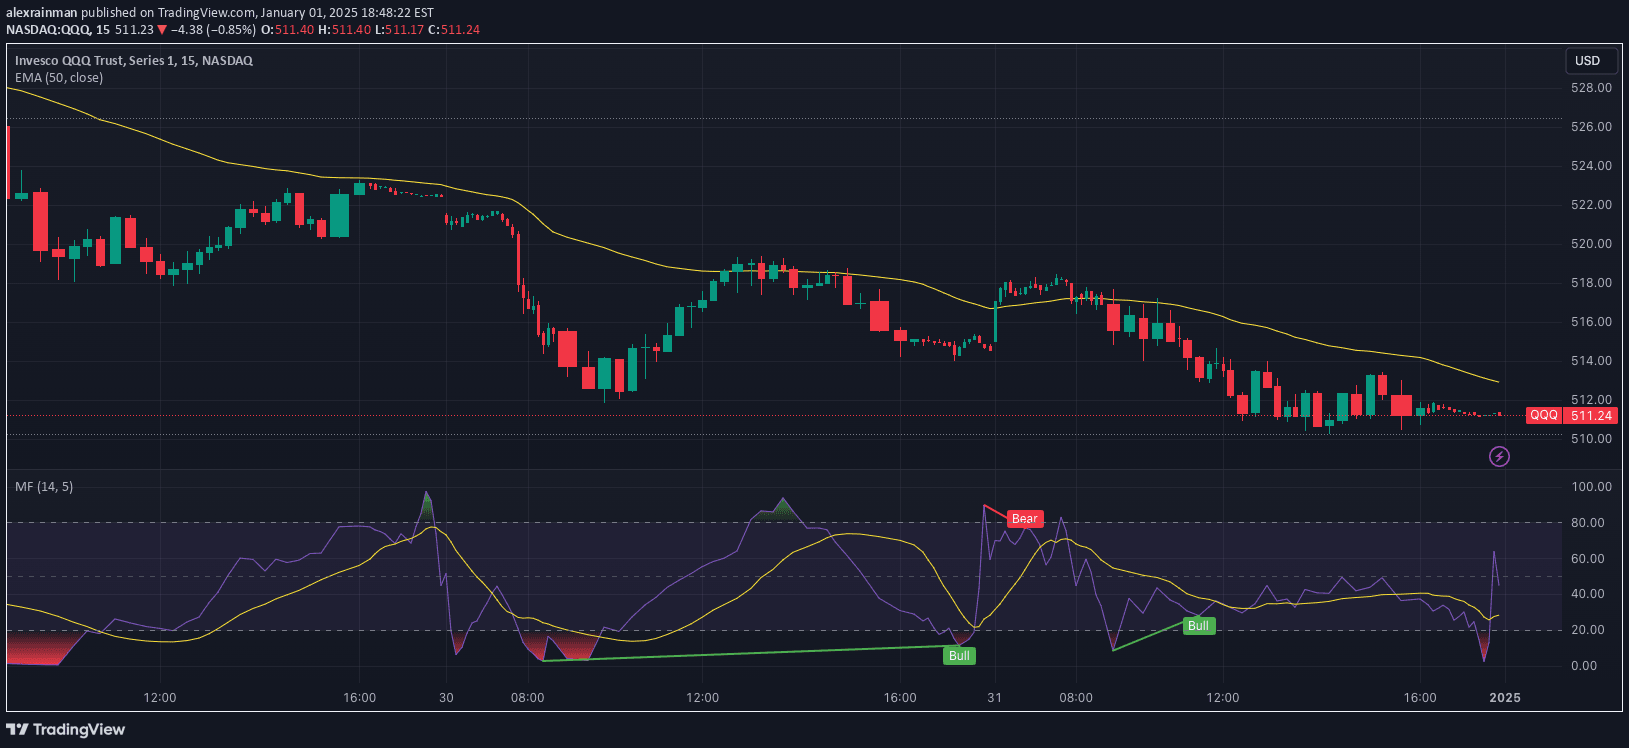
A hybrid technical indicator combining Stochastic Momentum Index Ergodic (SMII) with Money Flow Index (MFI) to analyze market momentum and buying/selling pressure more comprehensively.
Explore complementary indicator rolesHow it works
The Stochastic Momentum Index Ergodic (SMII) with Money Flow Index (MFI) operates as a sophisticated momentum oscillator that measures price change ratios and incorporates money flow dynamics. It calculates momentum by comparing smoothed price changes against smoothed absolute price changes, integrating a signal line through exponential moving average (EMA).
By utilizing Money Flow Index as an input instead of pure price data, the indicator provides a more nuanced view of market movements. The SMII tracks momentum shifts, with key reference points at -40 and +40, allowing traders to identify potential trend reversals and measure the underlying strength of price movements.
Why it may be useful
This indicator offers traders a more comprehensive market analysis tool by combining momentum measurement with money flow insights. It helps identify potential trend reversals more accurately by providing a deeper understanding of buying and selling pressures beyond traditional price-based indicators.
By incorporating concepts like 'ergodicity', the SMII with MFI can effectively filter out market noise and provide clearer signals. Traders can use this approach to gain more reliable entry and exit points, understanding not just price direction but the underlying market sentiment and momentum dynamics.
When to explore it
The SMII with MFI works best in markets with clear trending characteristics and moderate volatility. It is particularly effective when traders want to confirm potential trend reversals and assess the strength of price movements beyond simple price action analysis.
Ideal application includes identifying divergences between price and indicator, using signal line crossovers at -40 and +40 levels, and analyzing momentum shifts in various financial instruments. Traders should combine this indicator with other technical analysis tools for more robust trading decisions.
Keep exploring
What we’ve verified
Access, alerts and repainting behaviour have not been independently verified for this indicator. Check the creator’s current publication and settings.
General descriptions and classifications are recovered research. Verified details above identify the specific checks we have completed. Check the creator’s current publication for later changes.