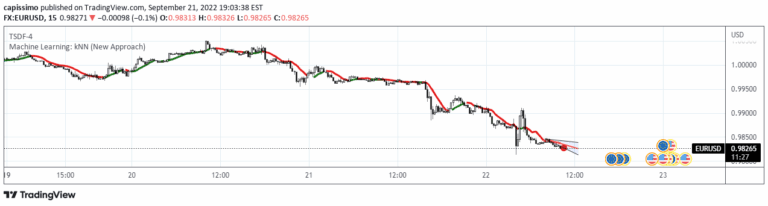
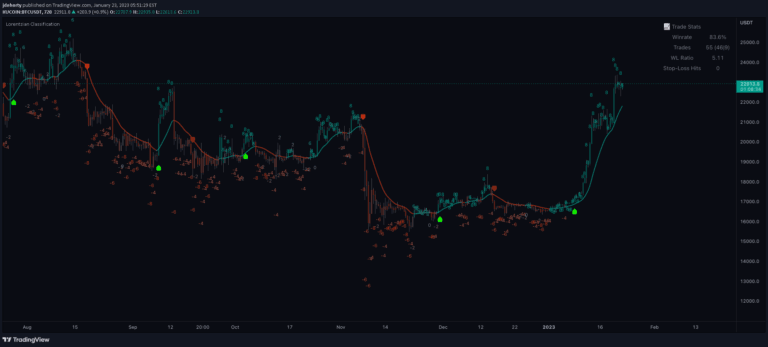
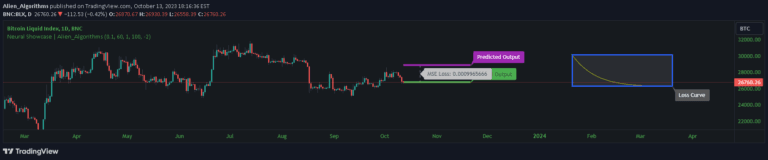
A statistical linear regression indicator that provides price targets, ranges, and trend reliability by analyzing historical price movements and projecting potential future price trajectories.
Explore complementary indicator rolesHow it works
The linear modeler indicator uses time series analysis and linear regression to create a statistical projection of potential price movements. It calculates a most likely target (MLT) within a specified number of candles and generates a probable trading range.
The indicator performs back-testing to assess the reliability of its projections by analyzing historical performance. It generates statistical probabilities for price targets and ranges based on current trend characteristics. The analysis considers multiple timeframes and plots potential future price movements using regression techniques
Why it may be useful
Traders benefit from this indicator by gaining statistical insights into potential price movements and trend reliability. It provides a data-driven approach to understanding market dynamics and potential future price trajectories.
The indicator helps traders identify high-probability price targets and trading ranges with confidence metrics. By offering back-tested reliability percentages, it allows traders to make more informed decisions. The linear regression approach provides a structured method for analyzing market trends beyond traditional moving averages
When to explore it
This indicator works best when analyzing stocks, commodities, or forex with consistent trending characteristics. It is most effective on timeframes ranging from hourly to daily charts. Traders should use it in conjunction with other technical indicators to confirm signals and validate projections.
The indicator is particularly useful during stable market conditions with clear directional trends. It provides valuable insights for swing traders and day traders looking for statistically supported price targets. Optimal performance occurs when used across multiple timeframes to cross-validate projections
Keep exploring
What we’ve verified
Access, alerts and repainting behaviour have not been independently verified for this indicator. Check the creator’s current publication and settings.
General descriptions and classifications are recovered research. Verified details above identify the specific checks we have completed. Check the creator’s current publication for later changes.