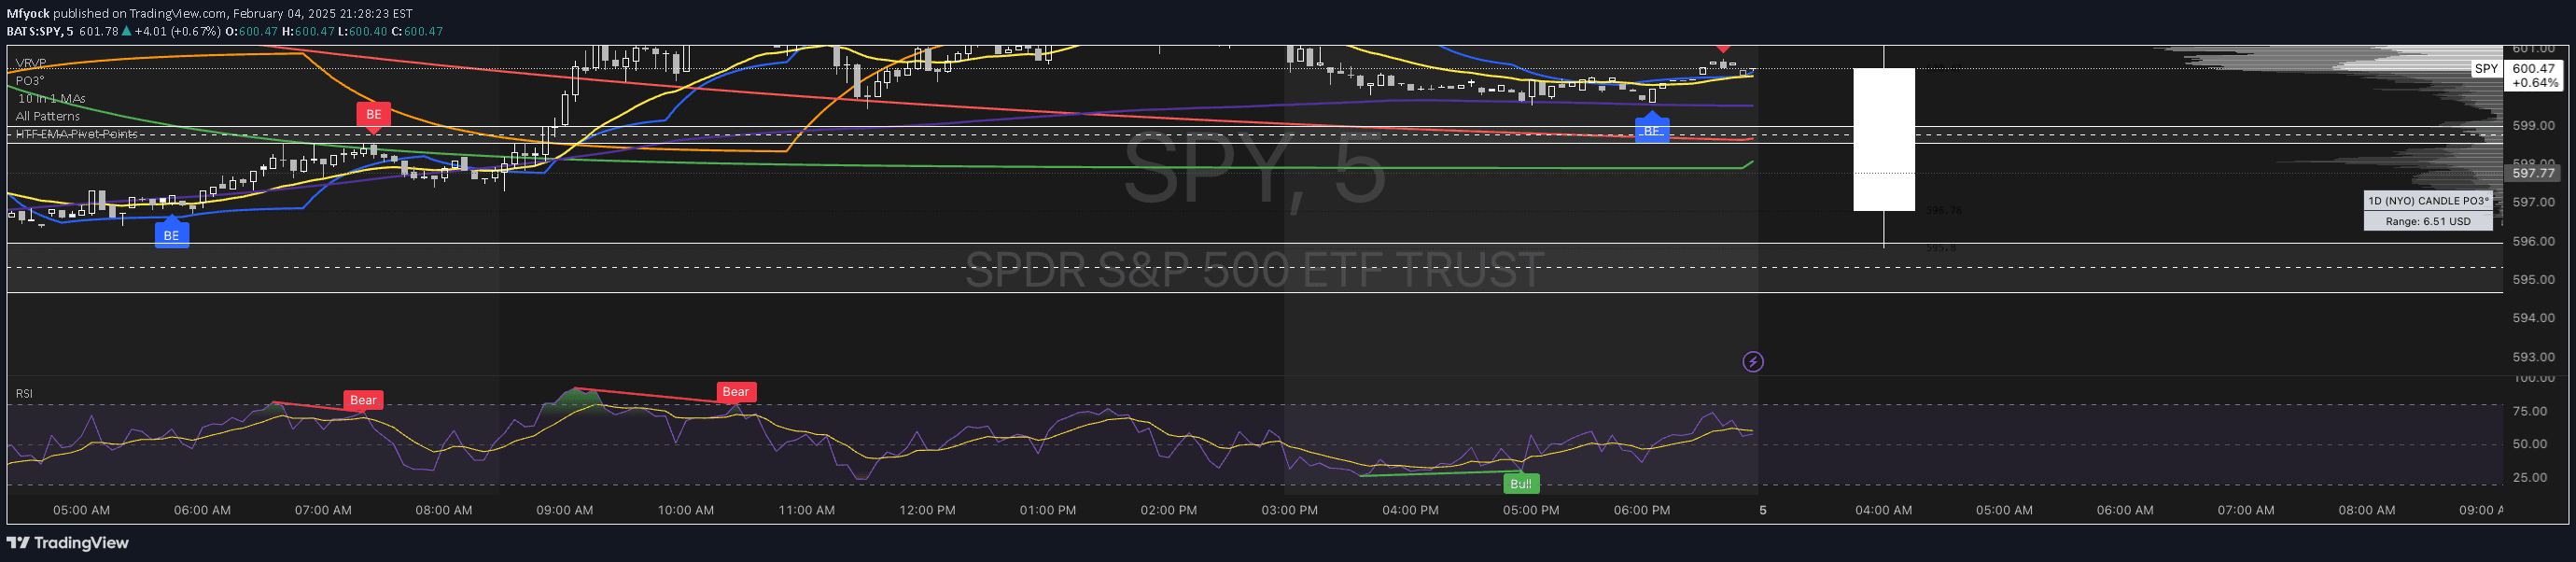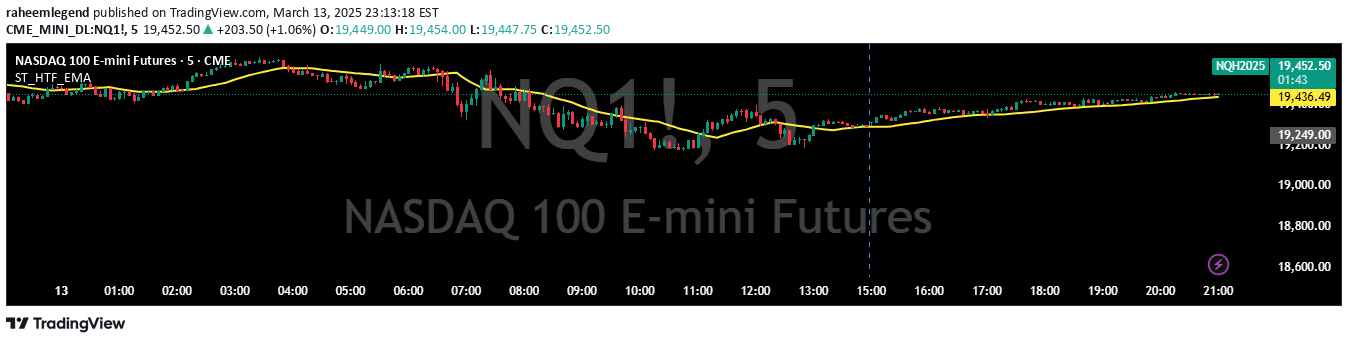
A higher timeframe 21-period EMA overlay that tracks trend direction and potential support/resistance zones across different market timeframes for enhanced trading insights.
Explore complementary indicator rolesHow it works
The ST_HTF_EMA indicator calculates a 21-period Exponential Moving Average from a higher timeframe and overlays it directly on the current chart. This process involves selecting a base timeframe (default 5-minute) and computing the EMA using exponential weighted calculations that give more importance to recent price data.
By plotting the EMA line on the current chart, traders can visually track trend direction and potential dynamic support/resistance levels. The optional envelope bands, set at 0.75%, create additional visual reference points around the main EMA line, helping traders identify potential price deviation zones and trend strength.
Why it may be useful
Higher timeframe EMAs provide traders with a broader market perspective, allowing them to align their trading decisions with more significant trend movements. By incorporating a longer-term view into shorter timeframe charts, traders can make more informed entry and exit decisions, reducing the risk of trading against the dominant market trend.
The ST_HTF_EMA's flexibility in timeframe selection and optional envelope bands makes it a versatile tool for understanding market dynamics. Traders can adapt the indicator to different market conditions, using it to confirm trend direction, identify potential reversal zones, and enhance overall trading strategy precision.
When to explore it
This indicator is most effective in trending markets where clear directional movement is present, helping traders identify and trade with the dominant market trend. It works particularly well when price is consistently above or below the EMA, signaling strong bullish or bearish momentum across different timeframes.
Traders can leverage the ST_HTF_EMA during periods of market consolidation or transition to gauge potential trend shifts and make more strategic trading decisions. The indicator is especially useful for traders who want to maintain a multi-timeframe perspective while executing trades on shorter timeframes.
Keep exploring
What we’ve verified
Access, alerts and repainting behaviour have not been independently verified for this indicator. Check the creator’s current publication and settings.
General descriptions and classifications are recovered research. Verified details above identify the specific checks we have completed. Check the creator’s current publication for later changes.