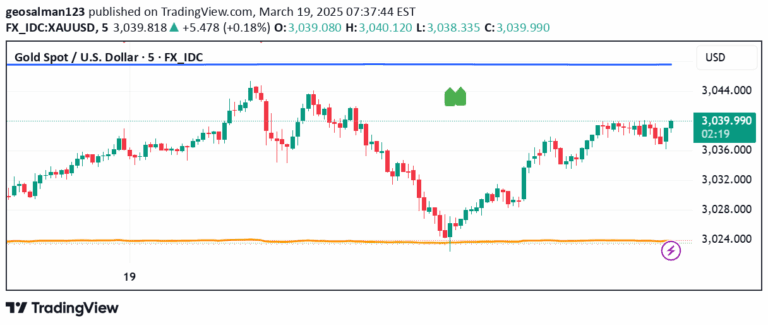
A statistical tool using Chi-Square Test to analyze the significance of trading conditions by comparing observed and expected outcomes across different groups.
Explore complementary indicator rolesHow it works
The Chi-Square Test is a statistical method that compares observed data against expected values to determine the significance of relationships between variables. Traders input multiple conditions like RSI levels, price movements, or other technical indicators into different groups, then calculate the Chi-Square statistic by comparing the actual occurrences with theoretically expected frequencies.
The calculation involves subtracting the expected value from the observed value, squaring the difference, and dividing by the expected value. This process is repeated for each cell in the data table, with the results summed to produce the Chi-Square statistic, which helps quantify the deviation from expected outcomes.
Why it may be useful
This statistical approach provides traders with a rigorous method to validate trading hypotheses by determining whether observed patterns are statistically significant or merely random chance. By analyzing the relationship between different market conditions and price movements, traders can gain insights into potential trading strategies with more confidence.
The P-value generated by the Chi-Square Test offers a clear threshold for evaluating the reliability of trading patterns. A P-value below 0.05 suggests that the observed relationship is statistically significant, helping traders distinguish between meaningful market behaviors and random fluctuations.
When to explore it
The Chi-Square Test is most effective when traders want to systematically evaluate trading conditions across multiple groups and determine the statistical significance of potential strategies. It works best with categorical data, such as price movements categorized as up, down, or equal, and requires a sufficiently large sample size to generate reliable results.
Traders should use this method when comparing different market conditions, such as how RSI levels correlate with price movements or how specific technical indicators interact with market trends. However, it's crucial to remember that statistical significance does not guarantee future performance, and the method should be used as part of a comprehensive trading analysis.
Keep exploring
What we’ve verified
Access, alerts and repainting behaviour have not been independently verified for this indicator. Check the creator’s current publication and settings.
General descriptions and classifications are recovered research. Verified details above identify the specific checks we have completed. Check the creator’s current publication for later changes.