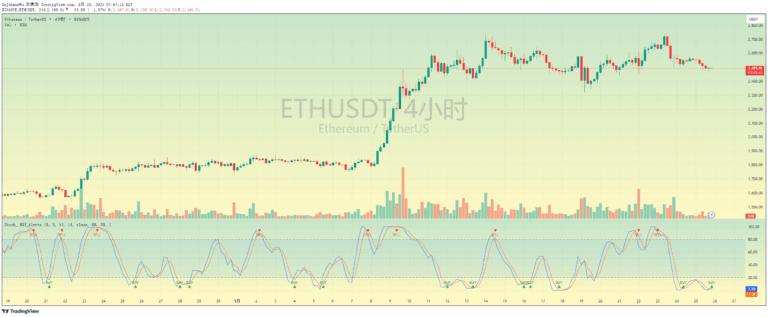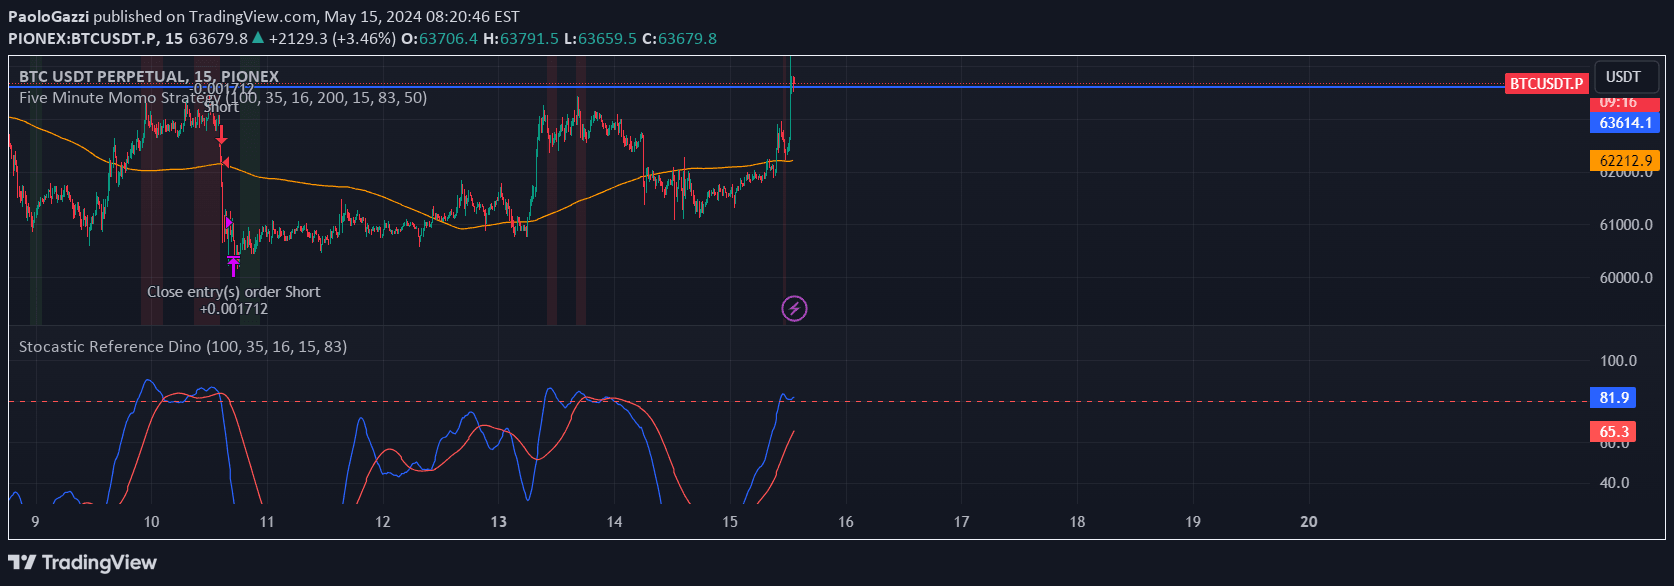
The Stocastic Reference Dino is a stochastic oscillator that analyzes market trends by measuring momentum through %K and %D lines, helping traders identify potential price reversals and market conditions.
Explore complementary indicator rolesHow it works
The Stocastic Reference Dino calculates two primary lines: %K and %D, which track market momentum by comparing closing prices to a specified period's price range. It first identifies the lowest low and highest high over a defined length, then computes the %K value as a percentage of this range, smoothed using a simple moving average.
The %D line is then calculated as a moving average of the %K line, creating a secondary smoothing mechanism. By plotting these lines on a separate panel with predefined low and high thresholds, traders can visually interpret potential market conditions and momentum shifts.
Why it may be useful
The Stocastic Reference Dino provides traders with a powerful tool to understand market momentum and potential trend reversals through its oscillating lines. By measuring the relationship between current price and its recent trading range, it offers insights into whether an asset is potentially overbought or oversold.
This indicator helps traders make more informed decisions by highlighting potential entry and exit points based on momentum signals. Its ability to adapt to different market conditions and timeframes makes it a versatile tool for analyzing price movements across various financial instruments.
When to explore it
The Stocastic Reference Dino is most effective in markets with clear trending or ranging characteristics, where momentum plays a significant role in price movement. It performs exceptionally well in markets with moderate volatility, where price fluctuations provide clear signals without excessive noise.
Traders should use this indicator in conjunction with other technical analysis tools to confirm signals and reduce false positives. It is particularly useful when combined with trend indicators, support and resistance levels, and additional momentum oscillators to validate potential trading opportunities.
Keep exploring
What we’ve verified
Access, alerts and repainting behaviour have not been independently verified for this indicator. Check the creator’s current publication and settings.
General descriptions and classifications are recovered research. Verified details above identify the specific checks we have completed. Check the creator’s current publication for later changes.