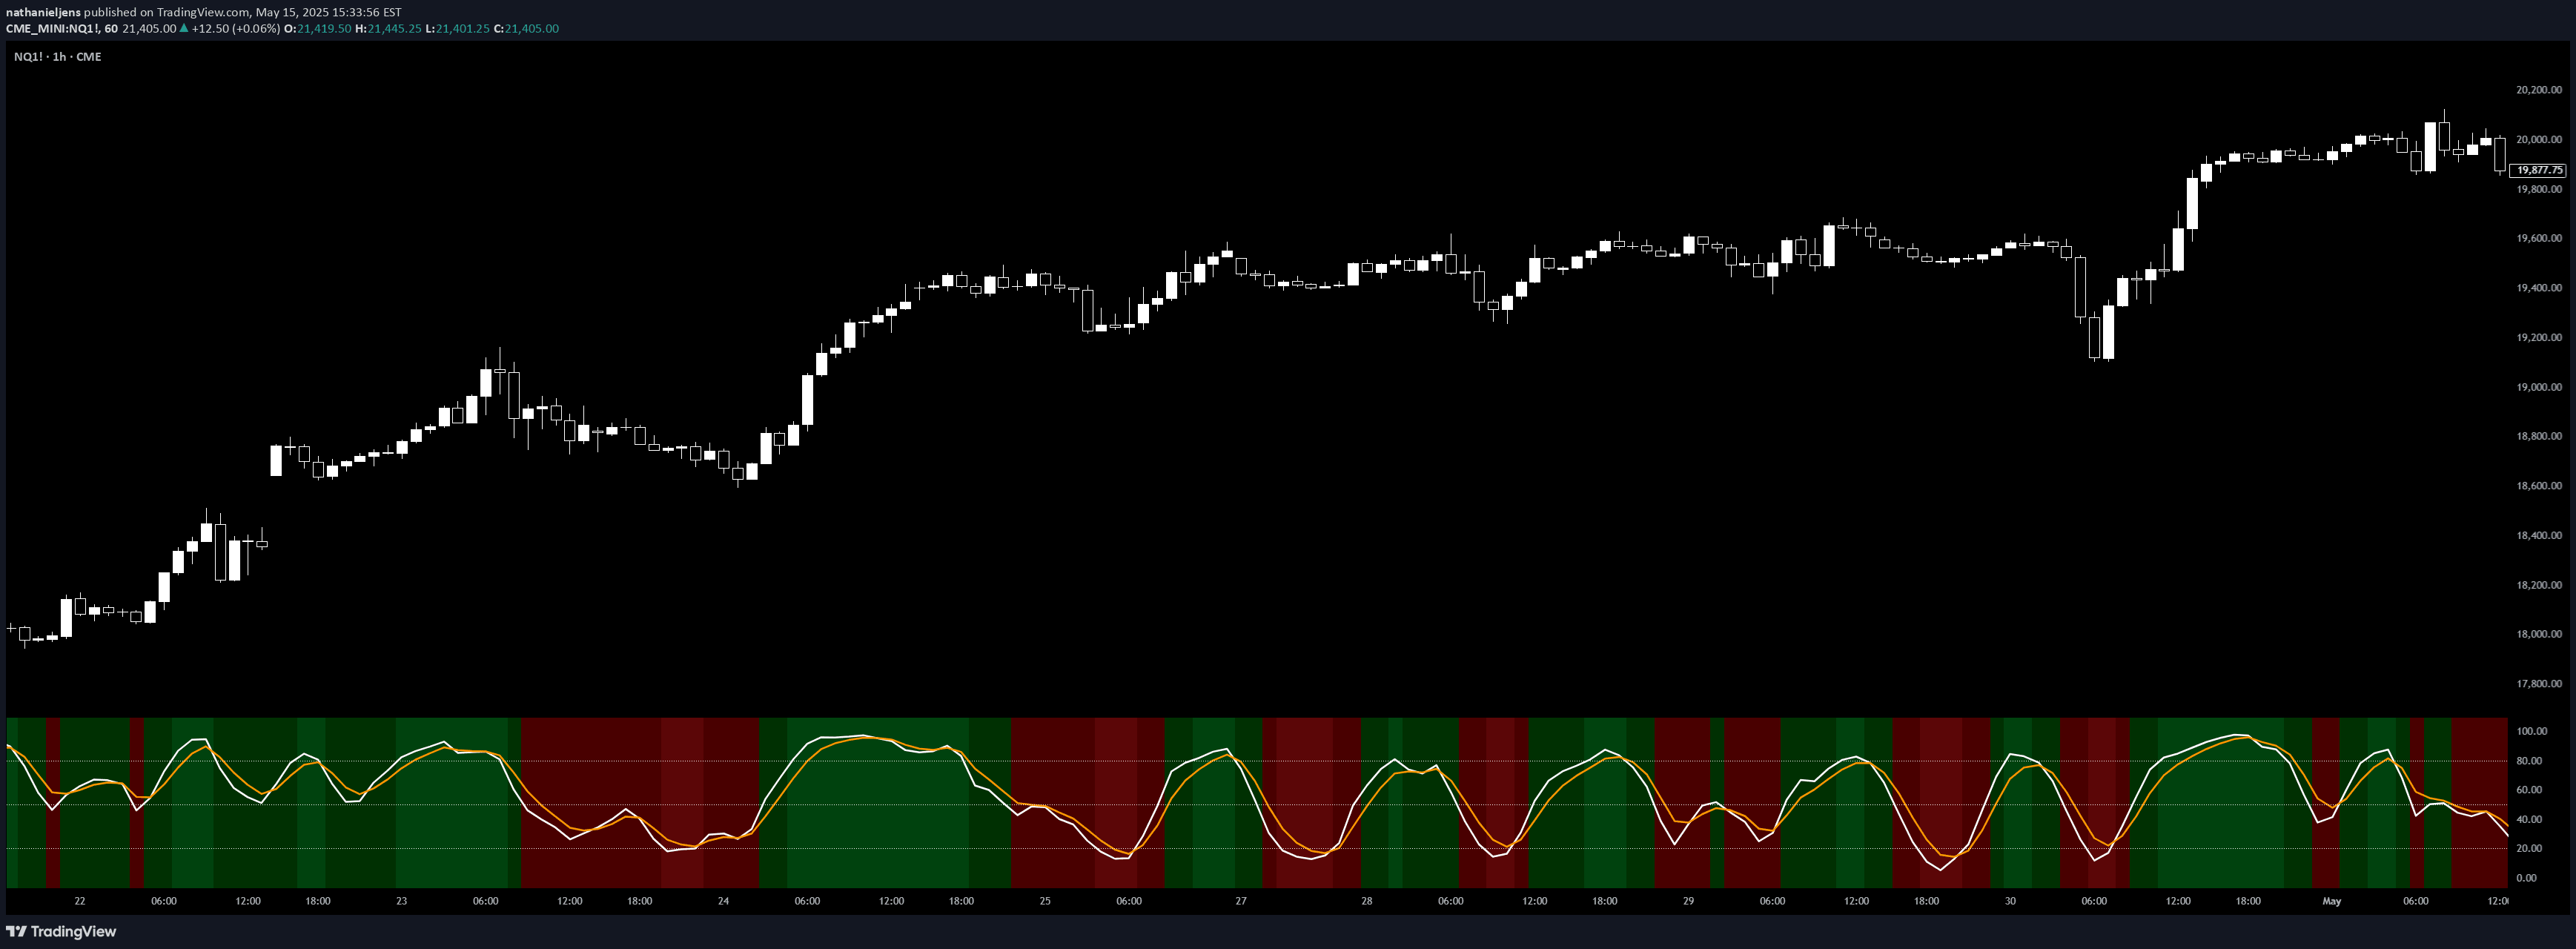
Enhanced Stochastic Oscillator with multiple smoothing options, allowing traders to customize the indicator's calculation using SMA, EMA, and VWMA methods.
Explore complementary indicator rolesHow it works
The Stochastic Oscillator is a momentum indicator that compares a closing price to its range over a specific period, generating values between 0 and 100. This enhanced version offers flexible smoothing calculations including Simple Moving Average (SMA), Exponential Moving Average (EMA), and Volume Weighted Moving Average (VWMA), allowing traders to refine the indicator's sensitivity and responsiveness.
By providing multiple smoothing options, the indicator allows users to adjust the calculation method based on their trading strategy and market conditions. The different smoothing techniques can help traders capture price momentum more accurately, with EMA and VWMA offering more nuanced interpretations compared to traditional SMA calculations.
Why it may be useful
The enhanced Stochastic Oscillator provides traders with a more sophisticated tool for analyzing market momentum and potential trend reversals. By offering multiple smoothing methods, it allows for greater customization and precision in identifying overbought and oversold conditions, which can be crucial for making informed trading decisions.
Different smoothing techniques can reveal subtle market dynamics that might be missed by standard calculations. The ability to switch between SMA, EMA, and VWMA enables traders to adapt the indicator to various market conditions, potentially improving the accuracy of entry and exit signals across different timeframes and asset classes.
When to explore it
This enhanced Stochastic Oscillator works best in trending and range-bound markets where momentum and price oscillations are significant. Traders can utilize this indicator most effectively when looking for potential trend reversals, divergences, and overbought or oversold conditions across different timeframes.
The multiple smoothing options make this indicator particularly useful for traders who want to fine-tune their analysis. By experimenting with different smoothing methods, traders can optimize the indicator's performance for specific market instruments, trading styles, and timeframe preferences, potentially increasing the reliability of their trading signals.
Keep exploring
What we’ve verified
Access, alerts and repainting behaviour have not been independently verified for this indicator. Check the creator’s current publication and settings.
General descriptions and classifications are recovered research. Verified details above identify the specific checks we have completed. Check the creator’s current publication for later changes.