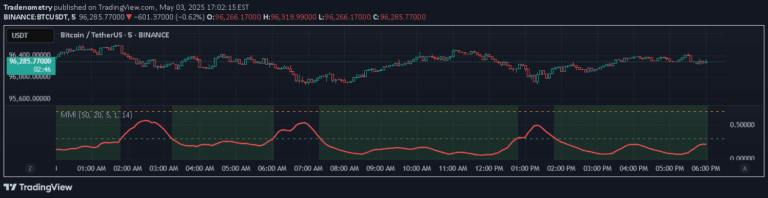
The Stochastic Momentum Index (SMI) is a technical indicator that compares current closing prices to price ranges, helping traders identify trend reversals and potential market turning points.
Explore complementary indicator rolesHow it works
The Stochastic Momentum Index (SMI) calculates the relationship between a financial instrument's closing price and its price range over a specific period. It uses the stochastic formula to compare the current closing price with the maximum and minimum price levels, creating an oscillator that moves between -100 and +100.
The indicator then applies a short-term moving average to this calculation, which helps smooth out the signal and provide more reliable information. When the SMI is above 0, it indicates the current price is above the short-term moving average, and when it's below 0, it suggests the price is below the moving average.
Why it may be useful
The SMI is crucial for traders because it provides insights into potential trend reversals and momentum shifts in the market. By identifying extreme levels above +40 or below -40, traders can anticipate possible changes in market direction and make more informed trading decisions.
Moreover, the indicator allows traders to spot divergences between the SMI and asset prices, which can signal potential trading opportunities. Its ability to oscillate and provide clear visual signals makes it a valuable tool for understanding market dynamics and identifying potential entry and exit points.
When to explore it
The SMI works best in markets with clear trending or oscillating price movements, making it particularly useful in forex, stocks, and commodity trading. Traders should use it most effectively when combined with other technical analysis tools to confirm signals and reduce false positives.
The indicator is especially powerful during periods of market volatility, where rapid price changes can create multiple trading opportunities. By paying attention to crossing points, extreme levels, and divergences, traders can leverage the SMI to enhance their market analysis and trading strategies.
Keep exploring
What we’ve verified
Access, alerts and repainting behaviour have not been independently verified for this indicator. Check the creator’s current publication and settings.
General descriptions and classifications are recovered research. Verified details above identify the specific checks we have completed. Check the creator’s current publication for later changes.