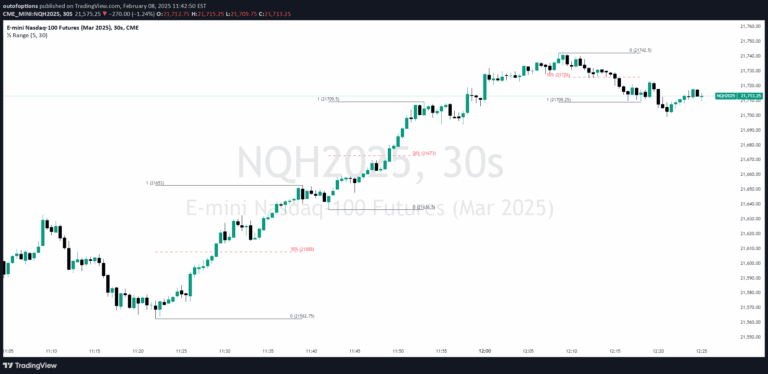
A trading indicator that automatically displays Sunday market open levels, providing traders with key reference points for potential support and resistance zones at the beginning of the week.
Explore complementary indicator rolesHow it works
The Sunday Open indicator automatically generates market open levels for the beginning of the trading week without requiring manual input. It identifies and plots the most recent Sunday Open levels directly on the price chart, with the current level distinguished by a unique color for easy visual recognition.
Traders can customize the indicator by selecting the number of levels to display, choosing colors, and adjusting line styles. The script works across different timeframes and provides a systematic approach to identifying potential support and resistance zones at the week's start.
Why it may be useful
The Sunday Open indicator provides traders with a valuable tool for understanding market structure and potential price movement at the beginning of each trading week. By automatically highlighting key reference levels, it helps traders quickly identify critical zones where price may react or change direction.
These predefined levels can serve as strategic entry, exit, or stop-loss points, enabling more precise trade planning and risk management. The ability to set up automatic alerts when price crosses these levels further enhances a trader's ability to respond quickly to market movements.
When to explore it
The Sunday Open indicator is most effective for traders looking to establish early week trading strategies across various timeframes and market conditions. It is particularly useful during periods of market transition, such as the start of a new trading week, when price levels can be more volatile and unpredictable.
Traders can leverage this indicator in trending and ranging markets, using the levels to identify potential breakout points, support and resistance zones, and to develop more structured trading approaches. It is especially beneficial for traders who want a systematic method of identifying key market levels without manual plotting.
Keep exploring
What we’ve verified
Access, alerts and repainting behaviour have not been independently verified for this indicator. Check the creator’s current publication and settings.
General descriptions and classifications are recovered research. Verified details above identify the specific checks we have completed. Check the creator’s current publication for later changes.