Divergence for Many Indicators v4
Advanced trading tool that detects divergences across multiple technical indicators, helping traders identify potential trend reversals and momentum shifts through comprehensive pivot point analysis.
Explore 11,183 indicators. Filter beyond the obvious.
Discover the tools that fit the way you trade.
11,183 tools to explore
Advanced trading tool that detects divergences across multiple technical indicators, helping traders identify potential trend reversals and momentum shifts through comprehensive pivot point analysis.
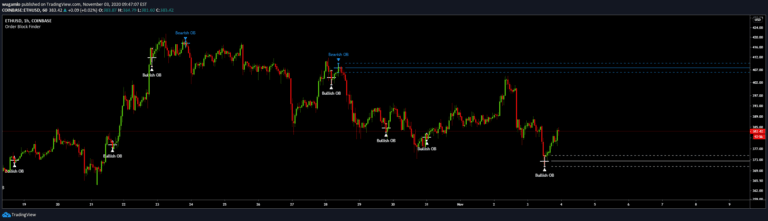
An indicator identifying institutional order blocks by detecting significant price zones where potential trend reversals or continuations might occur based on sequential candle patterns.
Pivot Point SuperTrend is an advanced trend-following indicator that combines pivot points with SuperTrend to generate more reliable trading signals and identify potential trend reversals.
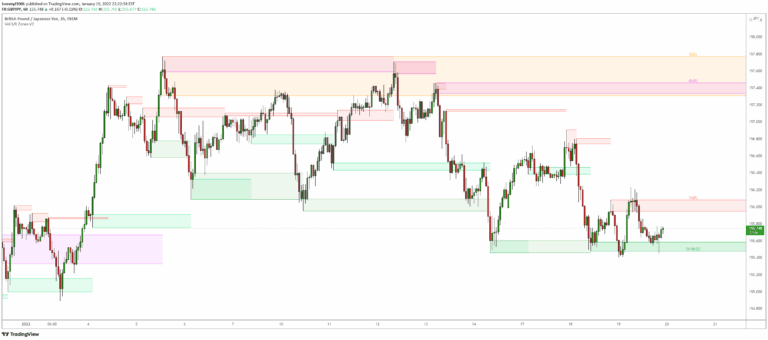
An advanced Support & Resistance indicator that identifies significant price zones using volume and fractal highs/lows, helping traders visualize potential trend reversals and continuations.
A liquidity indicator that highlights swing areas with trading activity, tracking price revisits, accumulated volume, and potential support/resistance zones using customizable filtering.
A multi-indicator divergence script that analyzes divergences across 10 different technical indicators to identify potential trend reversals and price movements.
A Volume Profile indicator that calculates trading volumes within a fixed range, helping traders understand volume distribution and identifying key price levels with visual representation.
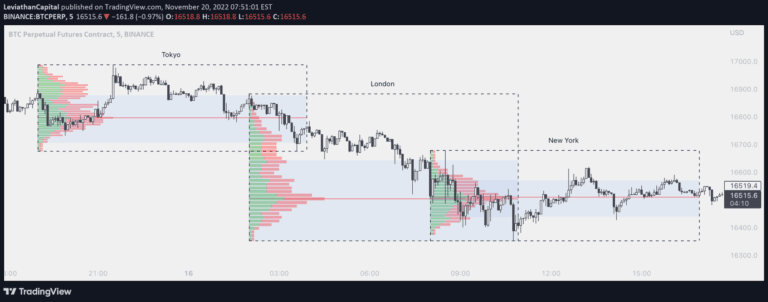
A comprehensive forex market session tracker with Volume Profile analysis that allows traders to visualize trading activity across different global market sessions and timeframes.
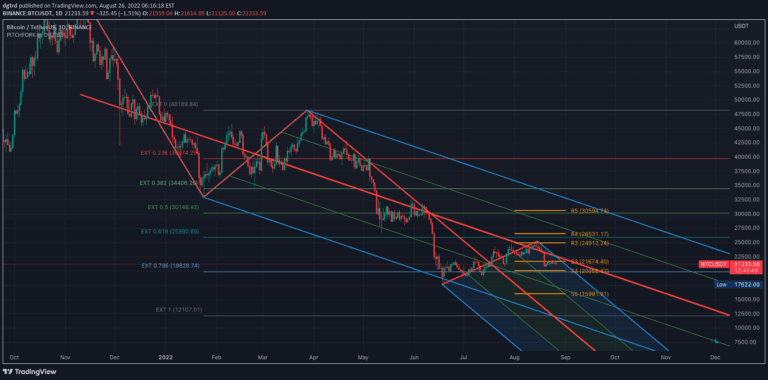
Pitchfork is a technical indicator that helps traders identify potential support and resistance levels by drawing trend lines based on three strategic points in price movement.
A comprehensive price action analysis tool that automatically identifies market structures, liquidity levels, order blocks, and potential trend shifts using pure price movement patterns.
A trading indicator tracking institutional investor actions by calculating probabilities of market structure changes and order flow direction for strategic trading decisions.
A charting tool that measures traded volume and money flow across price levels, revealing trading activity, sentiment, and key market levels for strategic analysis.
Likes, views, and comments are historical TradingView snapshots. They describe attention, not trading performance.