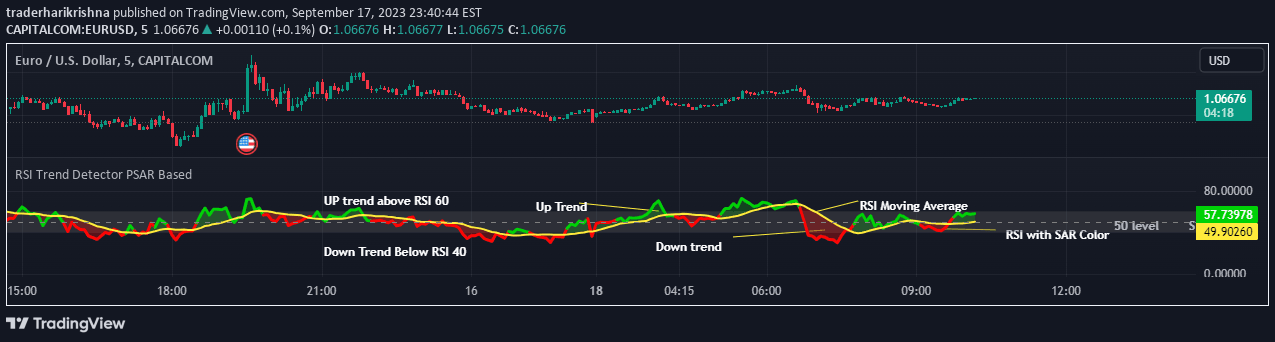
A support line indicator using stock price and RSI that helps identify potential trend reversals and support levels by creating a dynamic indicator based on price and RSI calculations.
Explore complementary indicator rolesHow it works
The indicator builds a support line by combining stock price and RSI using a complex formula that incorporates time window, percentage offset, and stability parameters. It calculates a new RSI value by blending the original RSI with a stability factor, which smooths out price fluctuations and creates a more reliable trend indicator.
The core calculation involves modifying the RSI and stock price through a formula that adjusts the close price based on the new RSI, offset percentage, and stability. This creates a dynamic line that can help traders identify potential support levels and price movements by showing how the indicator interacts with the actual stock price.
Why it may be useful
This indicator provides traders with a sophisticated tool for understanding potential price reversals and support levels by integrating multiple analytical components. By combining RSI with price data, it offers a more nuanced view of market movements than traditional single-metric indicators, helping traders make more informed decisions.
The flexibility of the indicator allows traders to adapt it to different stock behaviors by adjusting parameters like time window, offset, and stability. This customization makes it particularly useful for analyzing volatile stocks or markets where traditional support and resistance indicators might provide less reliable signals.
When to explore it
The indicator works best in markets with moderate to high volatility, particularly for stocks that experience significant price fluctuations like technology or growth stocks. It is especially useful when traders want to identify potential trend reversals and support levels beyond traditional technical analysis methods.
Traders should consider using this indicator when they need a more dynamic and adaptive approach to identifying market trends. It is particularly effective for stocks that demonstrate complex price movements and require a more sophisticated analysis tool that can adjust to changing market conditions.
Keep exploring
What we’ve verified
Access, alerts and repainting behaviour have not been independently verified for this indicator. Check the creator’s current publication and settings.
General descriptions and classifications are recovered research. Verified details above identify the specific checks we have completed. Check the creator’s current publication for later changes.