
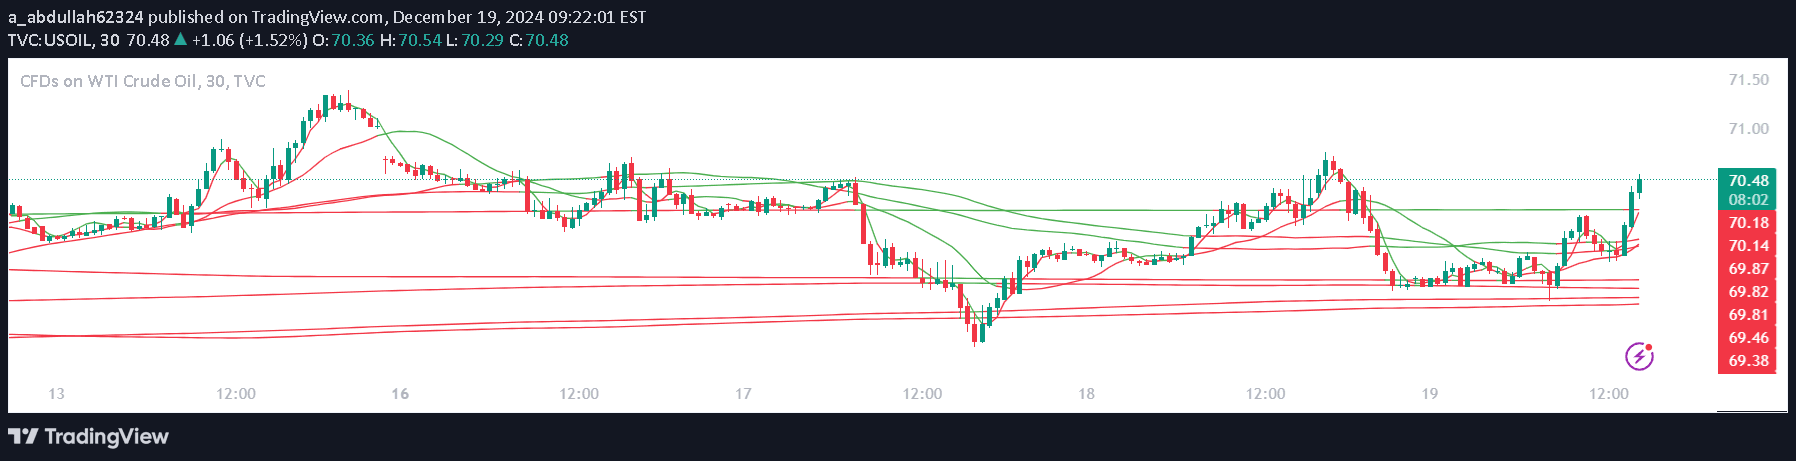
A comprehensive trading indicator combining moving averages, RSI, and MACD to generate precise buy and sell signals based on technical analysis and market momentum.
Explore complementary indicator rolesHow it works
The indicator integrates multiple technical analysis tools to generate trading signals. It calculates simple moving averages across different time periods, dynamically changing their color based on price position, which helps identify trend directions.
Simultaneously, it computes the Relative Strength Index (RSI) and Moving Average Convergence Divergence (MACD) to assess market momentum and potential trend reversals. By analyzing MACD crossovers, RSI levels, and volume, the indicator generates precise buy and sell signals that traders can use to make informed trading decisions.
Why it may be useful
This indicator provides traders with a multi-dimensional view of market dynamics by combining several powerful technical analysis tools into a single, comprehensive signal. It helps traders identify potential trend reversals, momentum shifts, and trading opportunities more accurately than single-indicator approaches.
By integrating moving averages, RSI, and MACD, the indicator offers a more holistic assessment of market conditions, reducing the likelihood of false signals and improving trade entry and exit strategies. Its ability to consider multiple technical factors simultaneously makes it a valuable tool for traders seeking robust and nuanced market analysis.
When to explore it
The indicator is most effective in markets with clear trending characteristics and moderate to high volatility. It works best when used on timeframes that allow sufficient signal development, such as daily or hourly charts for day and swing trading strategies.
Traders should apply this indicator in markets with consistent volume and when looking to confirm potential trend changes or momentum shifts. It is particularly useful during periods of market transition, where multiple technical indicators can provide stronger confirmation of emerging trading opportunities.
Keep exploring
What we’ve verified
Access, alerts and repainting behaviour have not been independently verified for this indicator. Check the creator’s current publication and settings.
General descriptions and classifications are recovered research. Verified details above identify the specific checks we have completed. Check the creator’s current publication for later changes.


