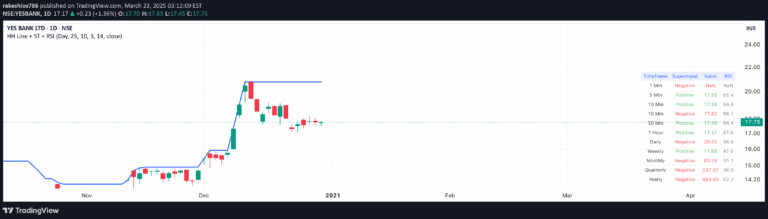
An advanced RSI visualization tool that allows multi-timeframe monitoring with customizable overbought and oversold levels, providing flexible and intuitive trading signal interpretation.
Explore complementary indicator rolesHow it works
The RSI multi-timeframe visualization tool operates by simultaneously displaying Relative Strength Index values across selected timeframes in an organized, configurable table. Users can customize the graphic times, lengths, and overbought/oversold levels according to their specific trading preferences and strategies.
Each cell in the table represents RSI values for a particular timeframe, with color-coded indicators highlighting when the RSI crosses predefined overbought or oversold thresholds. This dynamic representation allows traders to quickly assess momentum and potential trend reversals across multiple time horizons without switching between different charts.
Why it may be useful
This advanced RSI visualization tool provides traders with a comprehensive, at-a-glance view of market momentum across different timeframes, enabling more informed and nuanced trading decisions. By presenting RSI values in an intuitive, color-coded format, traders can quickly identify potential trend changes and market sentiment without complex manual calculations.
The flexibility to customize overbought and oversold levels makes this tool adaptable to various trading styles and market conditions, empowering traders to develop personalized strategies that align with their risk tolerance and market understanding.
When to explore it
The multi-timeframe RSI visualization is most effective when traders want to conduct comprehensive market analysis across different time horizons simultaneously. It is particularly useful during volatile market conditions where understanding momentum shifts quickly can provide a significant trading advantage.
Traders can leverage this tool during trend identification, potential reversal points, and when comparing momentum across different timeframes to confirm or challenge existing trading hypotheses. It is especially valuable for traders who employ multi-timeframe analysis strategies and seek a more holistic view of market dynamics.
Keep exploring
What we’ve verified
Access, alerts and repainting behaviour have not been independently verified for this indicator. Check the creator’s current publication and settings.
General descriptions and classifications are recovered research. Verified details above identify the specific checks we have completed. Check the creator’s current publication for later changes.