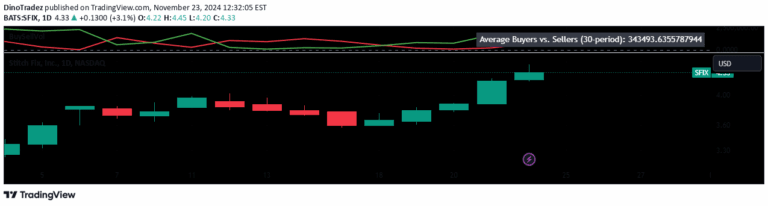
A volume trend heatmap screener that tracks the sell-to-buy ratio across multiple tickers, providing insights into selling and buying pressure over a customizable lookback period.
Explore complementary indicator rolesHow it works
The volume trend heatmap calculates the sell-to-buy ratio by dividing selling volume by buying volume for each ticker. It uses a default 25-day lookback period, which can be adjusted to suit different trading preferences. The indicator visualizes the ratio through color intensity, with brighter colors representing more significant volume trends.
A ratio of 1 or higher indicates heavy selling pressure, while the percentage change reveals the trend's direction. A negative percentage suggests decreasing selling and increasing buying, providing traders with a quick visual overview of volume dynamics across multiple stocks.
Why it may be useful
This volume trend heatmap offers traders a rapid, comprehensive view of market sentiment across multiple tickers. By quickly identifying selling and buying pressures, traders can make more informed decisions about potential entry and exit points. The color-coded visualization makes it easy to spot significant volume trends at a glance.
The indicator's flexibility in adjusting the lookback period allows traders to customize their analysis to match their specific trading style and timeframe. It provides a unique perspective on market dynamics that goes beyond traditional volume indicators, helping traders identify potential shifts in market momentum.
When to explore it
The volume trend heatmap is most effective for active traders who need quick insights into multiple stocks simultaneously. It works best in volatile markets where volume trends can provide early signals of potential price movements. Traders can use this tool to identify stocks with significant buying or selling pressure across different sectors.
The indicator is particularly useful for day traders and scalpers who rely on short-term volume trends to make rapid trading decisions. It can help identify potential momentum shifts and provide a broader market context when analyzing individual stock movements.
Keep exploring
What we’ve verified
Access, alerts and repainting behaviour have not been independently verified for this indicator. Check the creator’s current publication and settings.
General descriptions and classifications are recovered research. Verified details above identify the specific checks we have completed. Check the creator’s current publication for later changes.